



Więcej o książce
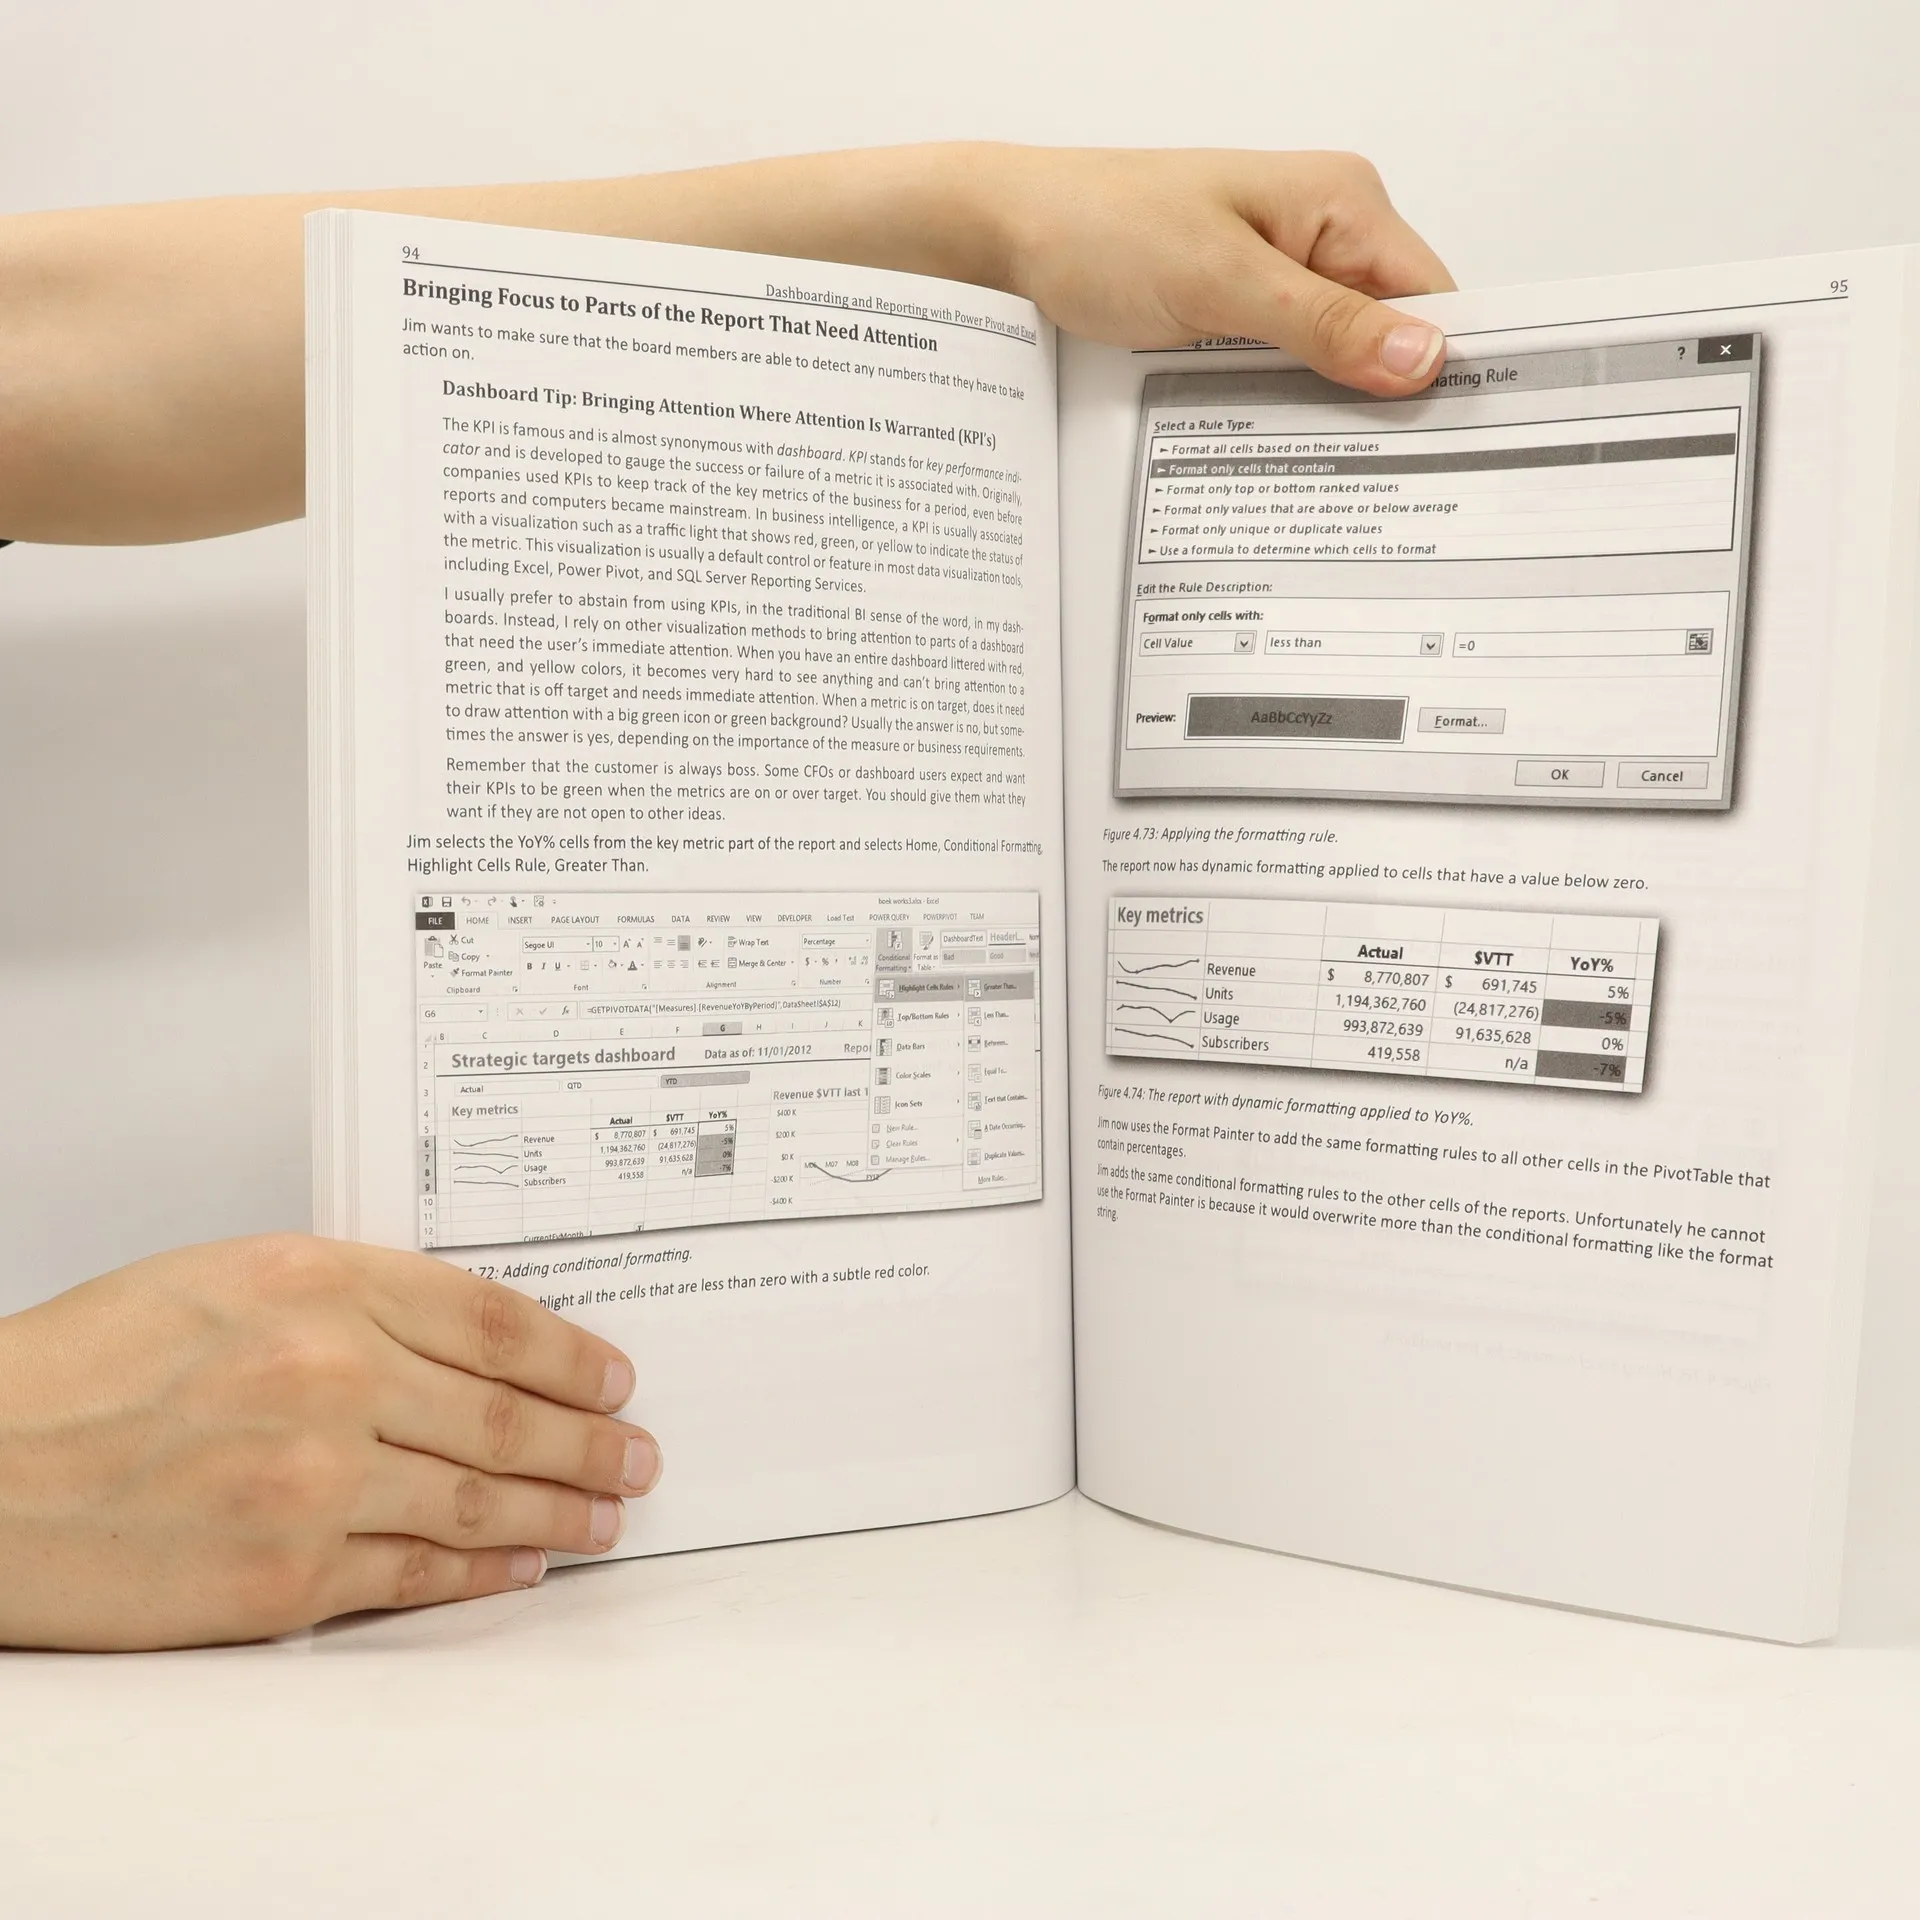
Microsoft’s revolutionary Power Pivot is a tool that allows users to create and transform data into reports and dashboards in new and much more powerful ways using the most-used analytical tool in the world: Excel. This book, written by a member of Microsoft’s Power Pivot team, provides a practical step by step guide on creating a financial dashboard. The book covers in detail how to combine and shape the relevant data, build the dashboard in Excel, providing layout and design tips and tricks, prepare the model to work with fiscal dates, and show values used in many financial reports, including year-to-date, variance-to-target, percentage-of-total, and running totals reports. Accessibly written, this book offers readers a practical, real-world scenario and can be used as a day-to-day reference. Though the guide focuses on Power Pivot for Excel 2010, a chapter that discusses Power View—compatible with Excel 2013— and Power BI is also included.
Zakup książki
Dashboarding and Reporting with Power Pivot and Excel, Kasper de Jonge
- Język

- Rok wydania
- 2014
- Oprawa
- (miękka)
Metody płatności
Brakuje nam tutaj Twojej recenzji.
- Tytuł
- Dashboarding and Reporting with Power Pivot and Excel
- Język
- angielski
- Autorzy
- Kasper de Jonge
- Wydawca
- Holy Macro!
- Rok wydania
- 2014
- Oprawa
- miękka
- Liczba stron
- 184
- ISBN10
- 1615470271
- ISBN13
- 9781615470273
- Seria
- Kategorie
- Tagi
- Ocena
- 4,1 z 5
- Opis
- Microsoft’s revolutionary Power Pivot is a tool that allows users to create and transform data into reports and dashboards in new and much more powerful ways using the most-used analytical tool in the world: Excel. This book, written by a member of Microsoft’s Power Pivot team, provides a practical step by step guide on creating a financial dashboard. The book covers in detail how to combine and shape the relevant data, build the dashboard in Excel, providing layout and design tips and tricks, prepare the model to work with fiscal dates, and show values used in many financial reports, including year-to-date, variance-to-target, percentage-of-total, and running totals reports. Accessibly written, this book offers readers a practical, real-world scenario and can be used as a day-to-day reference. Though the guide focuses on Power Pivot for Excel 2010, a chapter that discusses Power View—compatible with Excel 2013— and Power BI is also included.