

Więcej o książce
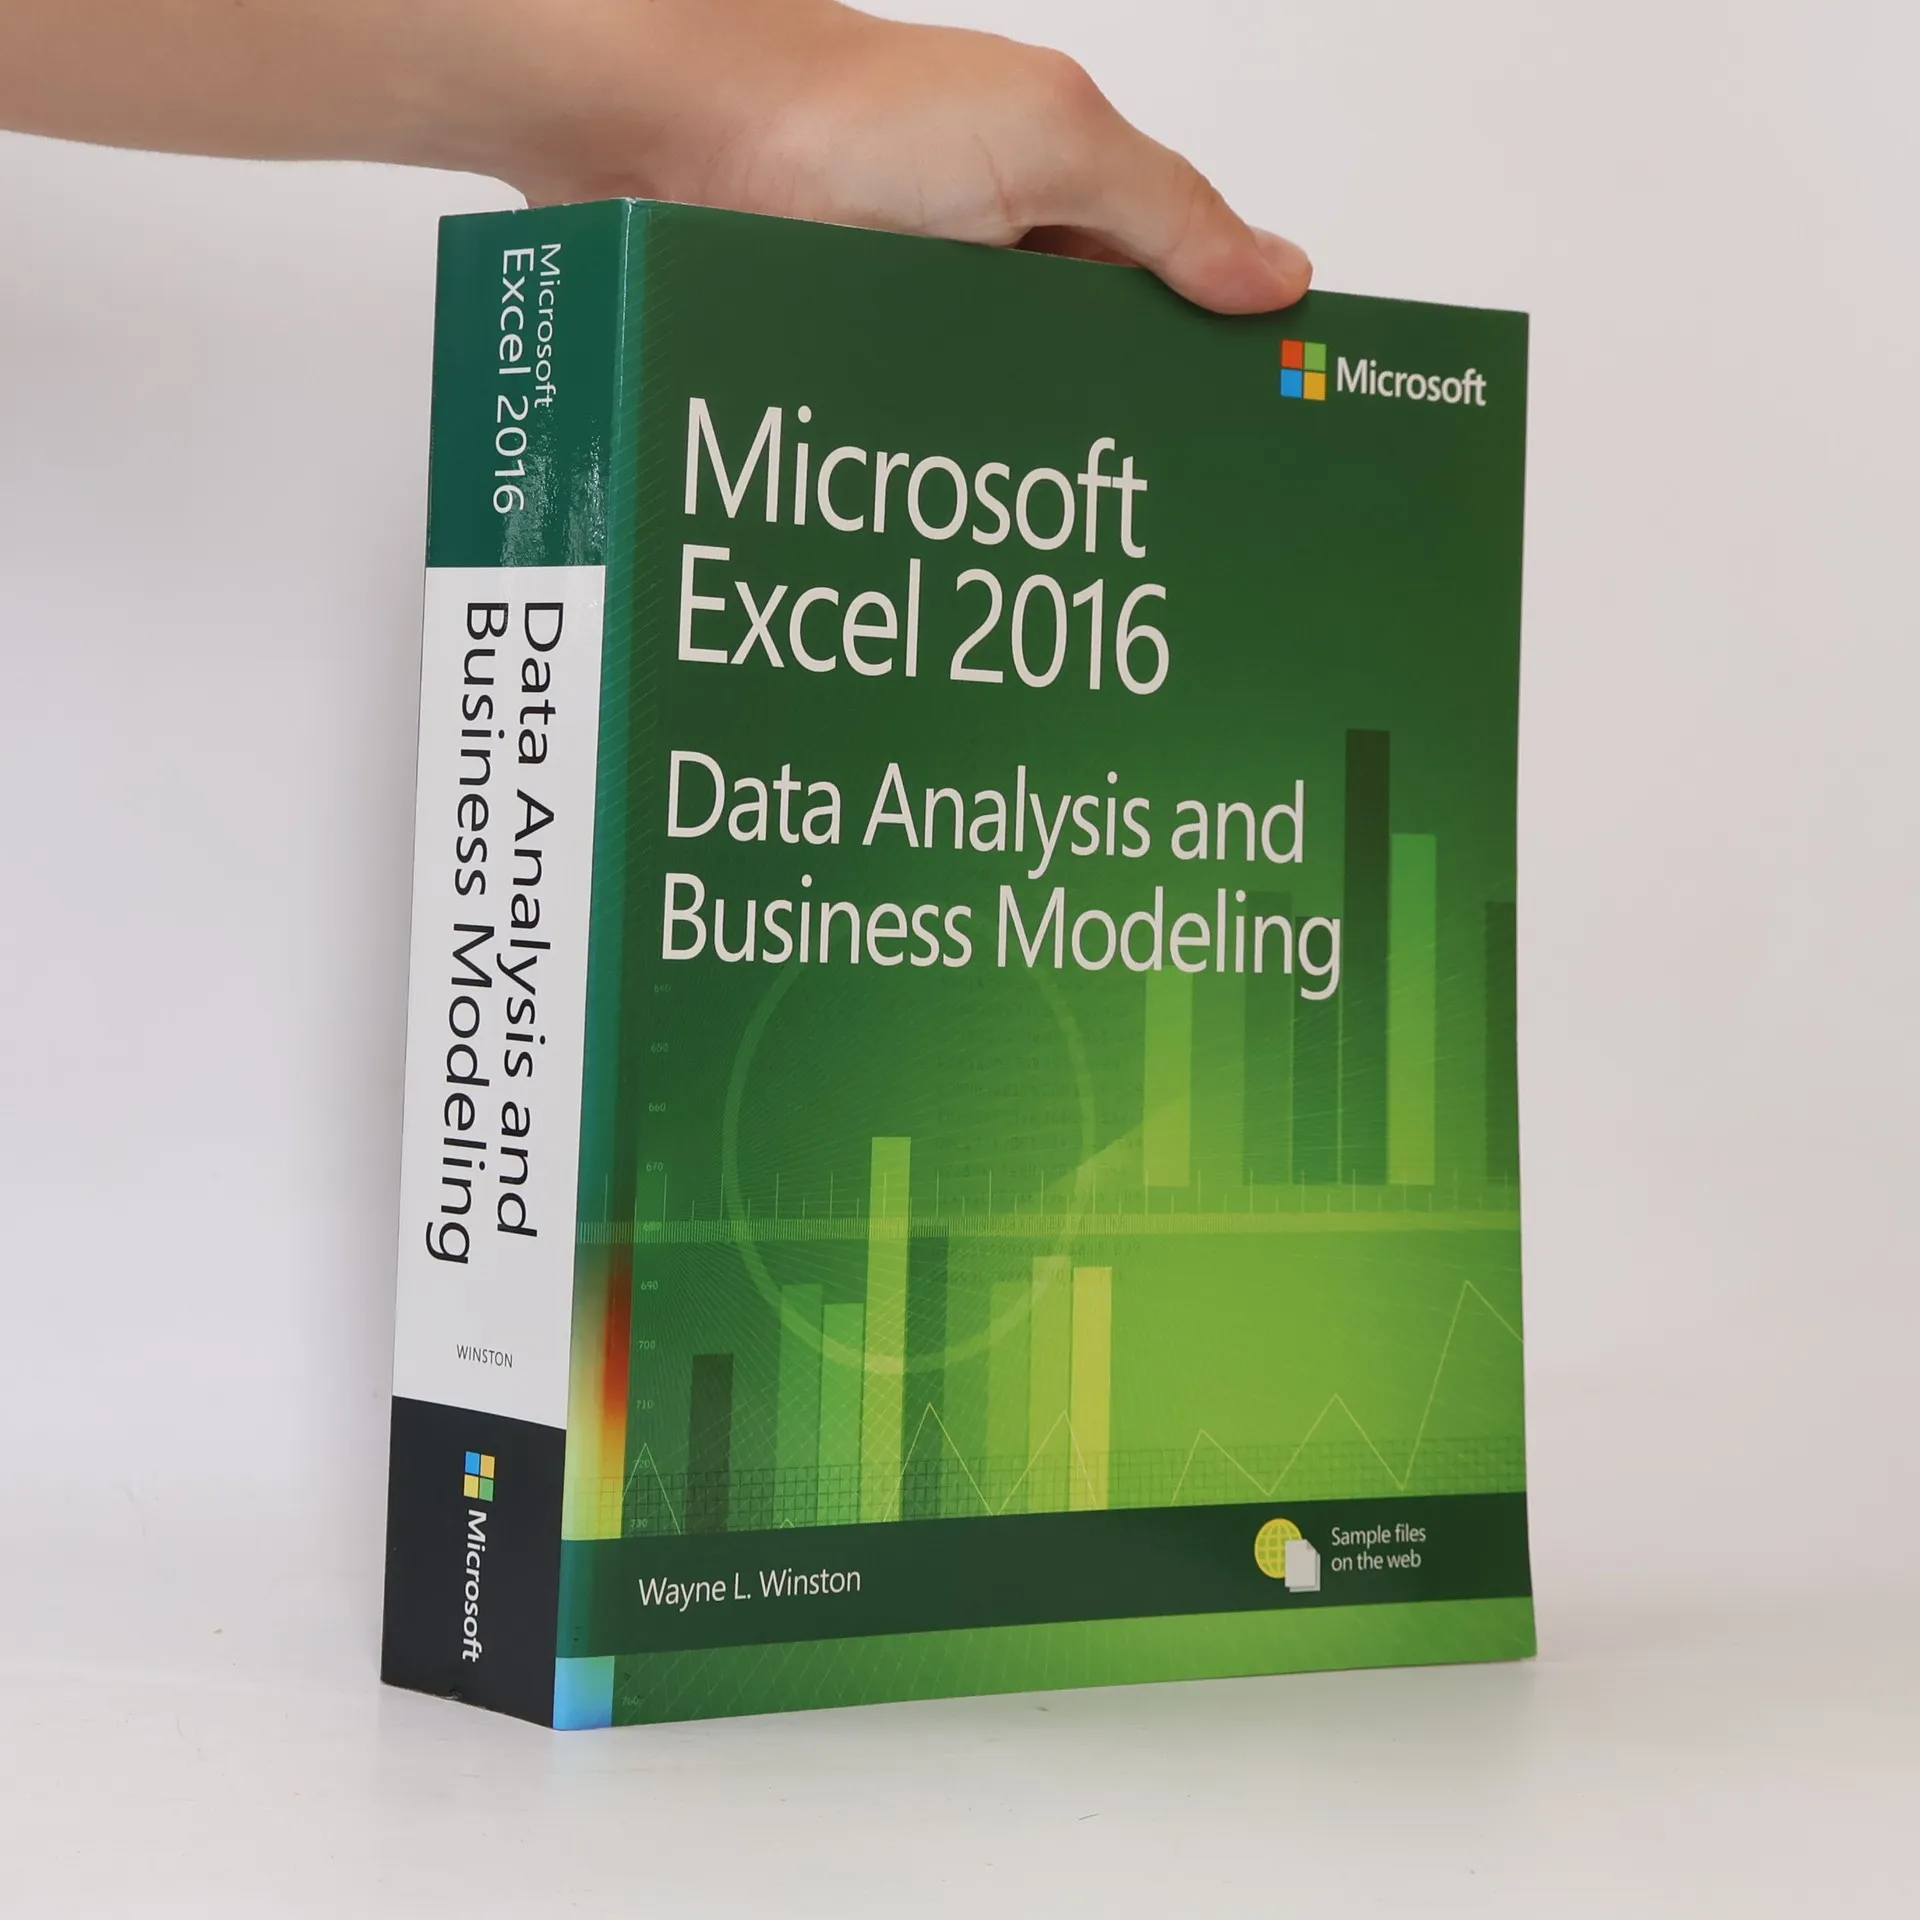
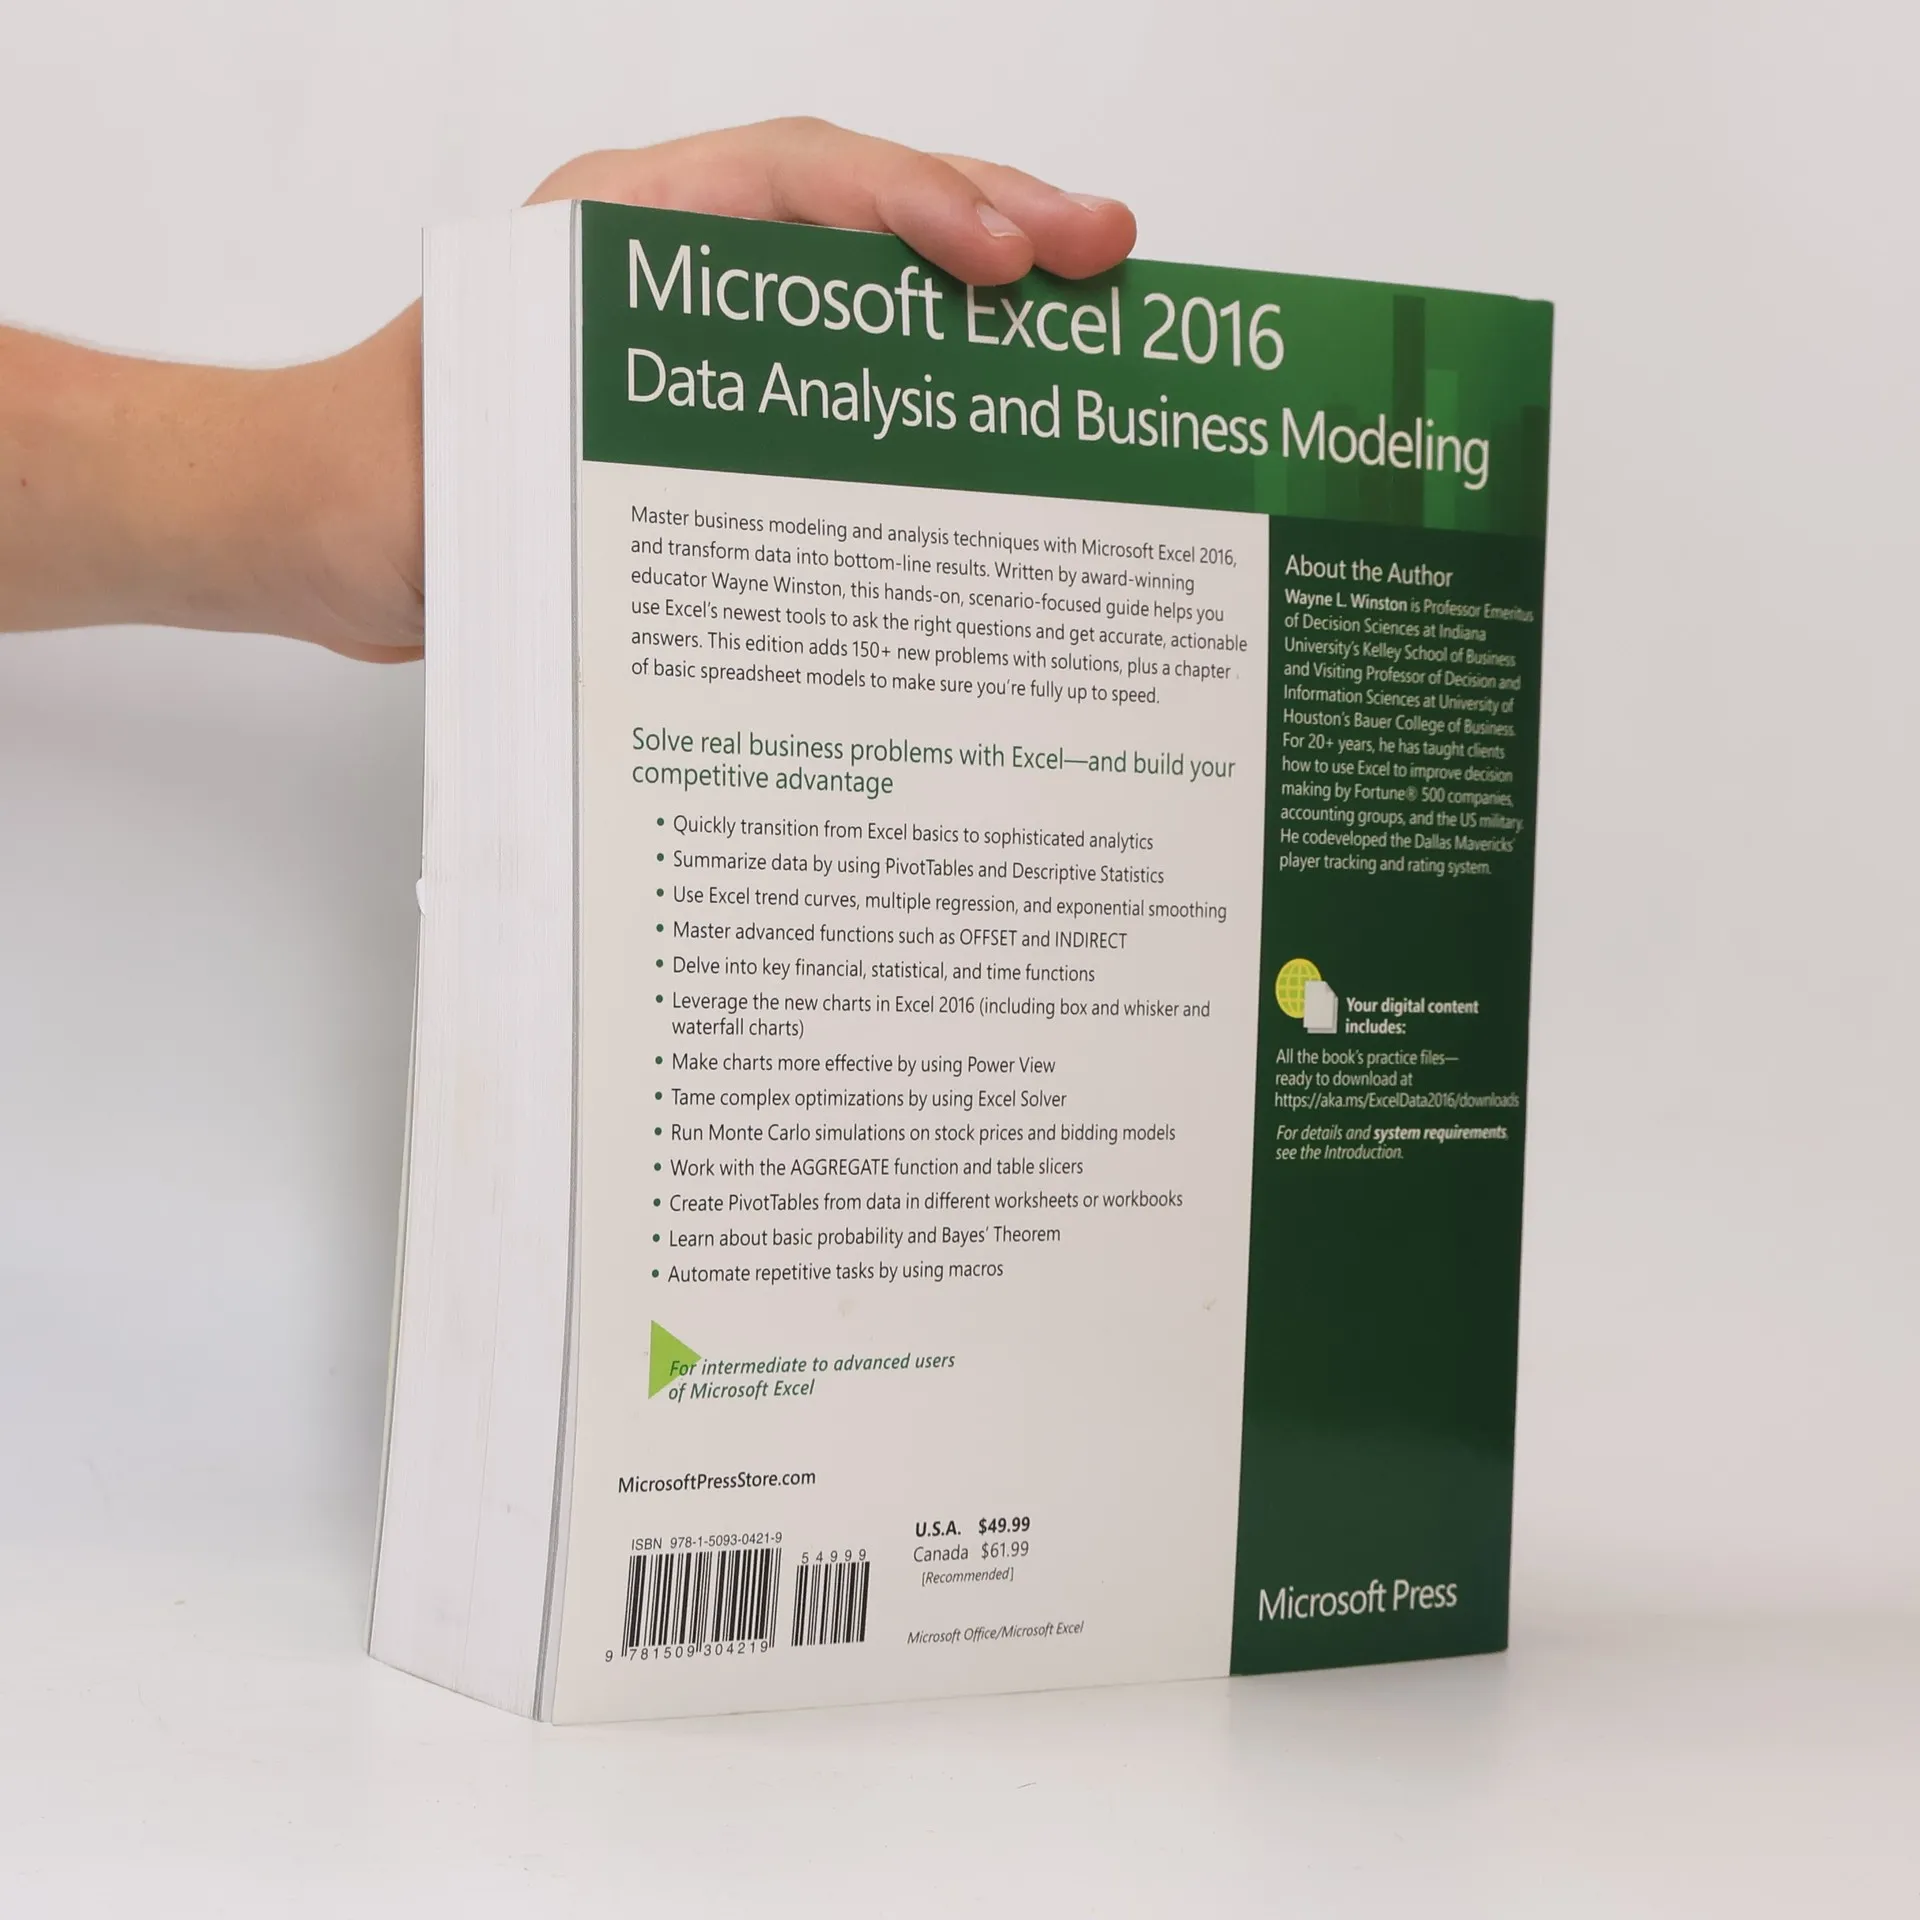
Written by award-winning educator Wayne Winston, this hands-on, scenario-focused guide will help you apply Excel 2016's most valuable innovations for data analysis and business modeling. It's packed with realistic problems and solutions to help you gain mastery -- including over 150 that are new or revised. Coverage includes: Quickly transitioning from basic Excel to more sophisticated analytics Summarizing data with PivotTables and Descriptive Statistics Exploring new trends in predictive and prescriptive analytics Using Excel Trend Curves, multiple regression, and exponential smoothing Mastering advanced Excel functions such as OFFSET and INDIRECT Delving into key financial, statistical, and time functions Making charts more effective with Power View Tame complex optimization problems with Excel Solver Running Monte Carlo simulations on stock prices and bidding models Using Excel 2016's new FORECAST and Power Map tools Working with the AGGREGATE function and Table Slicers Creating multiple PivotTables from a filter Using HYPERLINKS, ISFORMULA, and UNICODE Performing sensitivity analyses with more than two variables Making the most of the Inquire add-in And much more "
Zakup książki
Microsoft Excel Data Analysis and Business Modeling, Wayne L. Winston
- Język

- Rok wydania
- 2016
- Oprawa
- (miękka)
Metody płatności
Brakuje nam tutaj Twojej recenzji.
- Tytuł
- Microsoft Excel Data Analysis and Business Modeling
- Język
- angielski
- Autorzy
- Wayne L. Winston
- Wydawca
- Microsoft Press,U.S.
- Rok wydania
- 2016
- Oprawa
- miękka
- Liczba stron
- 864
- ISBN10
- 1509304215
- ISBN13
- 9781509304219
- Seria
- Ocena
- 4 z 5
- Opis
- Written by award-winning educator Wayne Winston, this hands-on, scenario-focused guide will help you apply Excel 2016's most valuable innovations for data analysis and business modeling. It's packed with realistic problems and solutions to help you gain mastery -- including over 150 that are new or revised. Coverage includes: Quickly transitioning from basic Excel to more sophisticated analytics Summarizing data with PivotTables and Descriptive Statistics Exploring new trends in predictive and prescriptive analytics Using Excel Trend Curves, multiple regression, and exponential smoothing Mastering advanced Excel functions such as OFFSET and INDIRECT Delving into key financial, statistical, and time functions Making charts more effective with Power View Tame complex optimization problems with Excel Solver Running Monte Carlo simulations on stock prices and bidding models Using Excel 2016's new FORECAST and Power Map tools Working with the AGGREGATE function and Table Slicers Creating multiple PivotTables from a filter Using HYPERLINKS, ISFORMULA, and UNICODE Performing sensitivity analyses with more than two variables Making the most of the Inquire add-in And much more "