


Więcej o książce
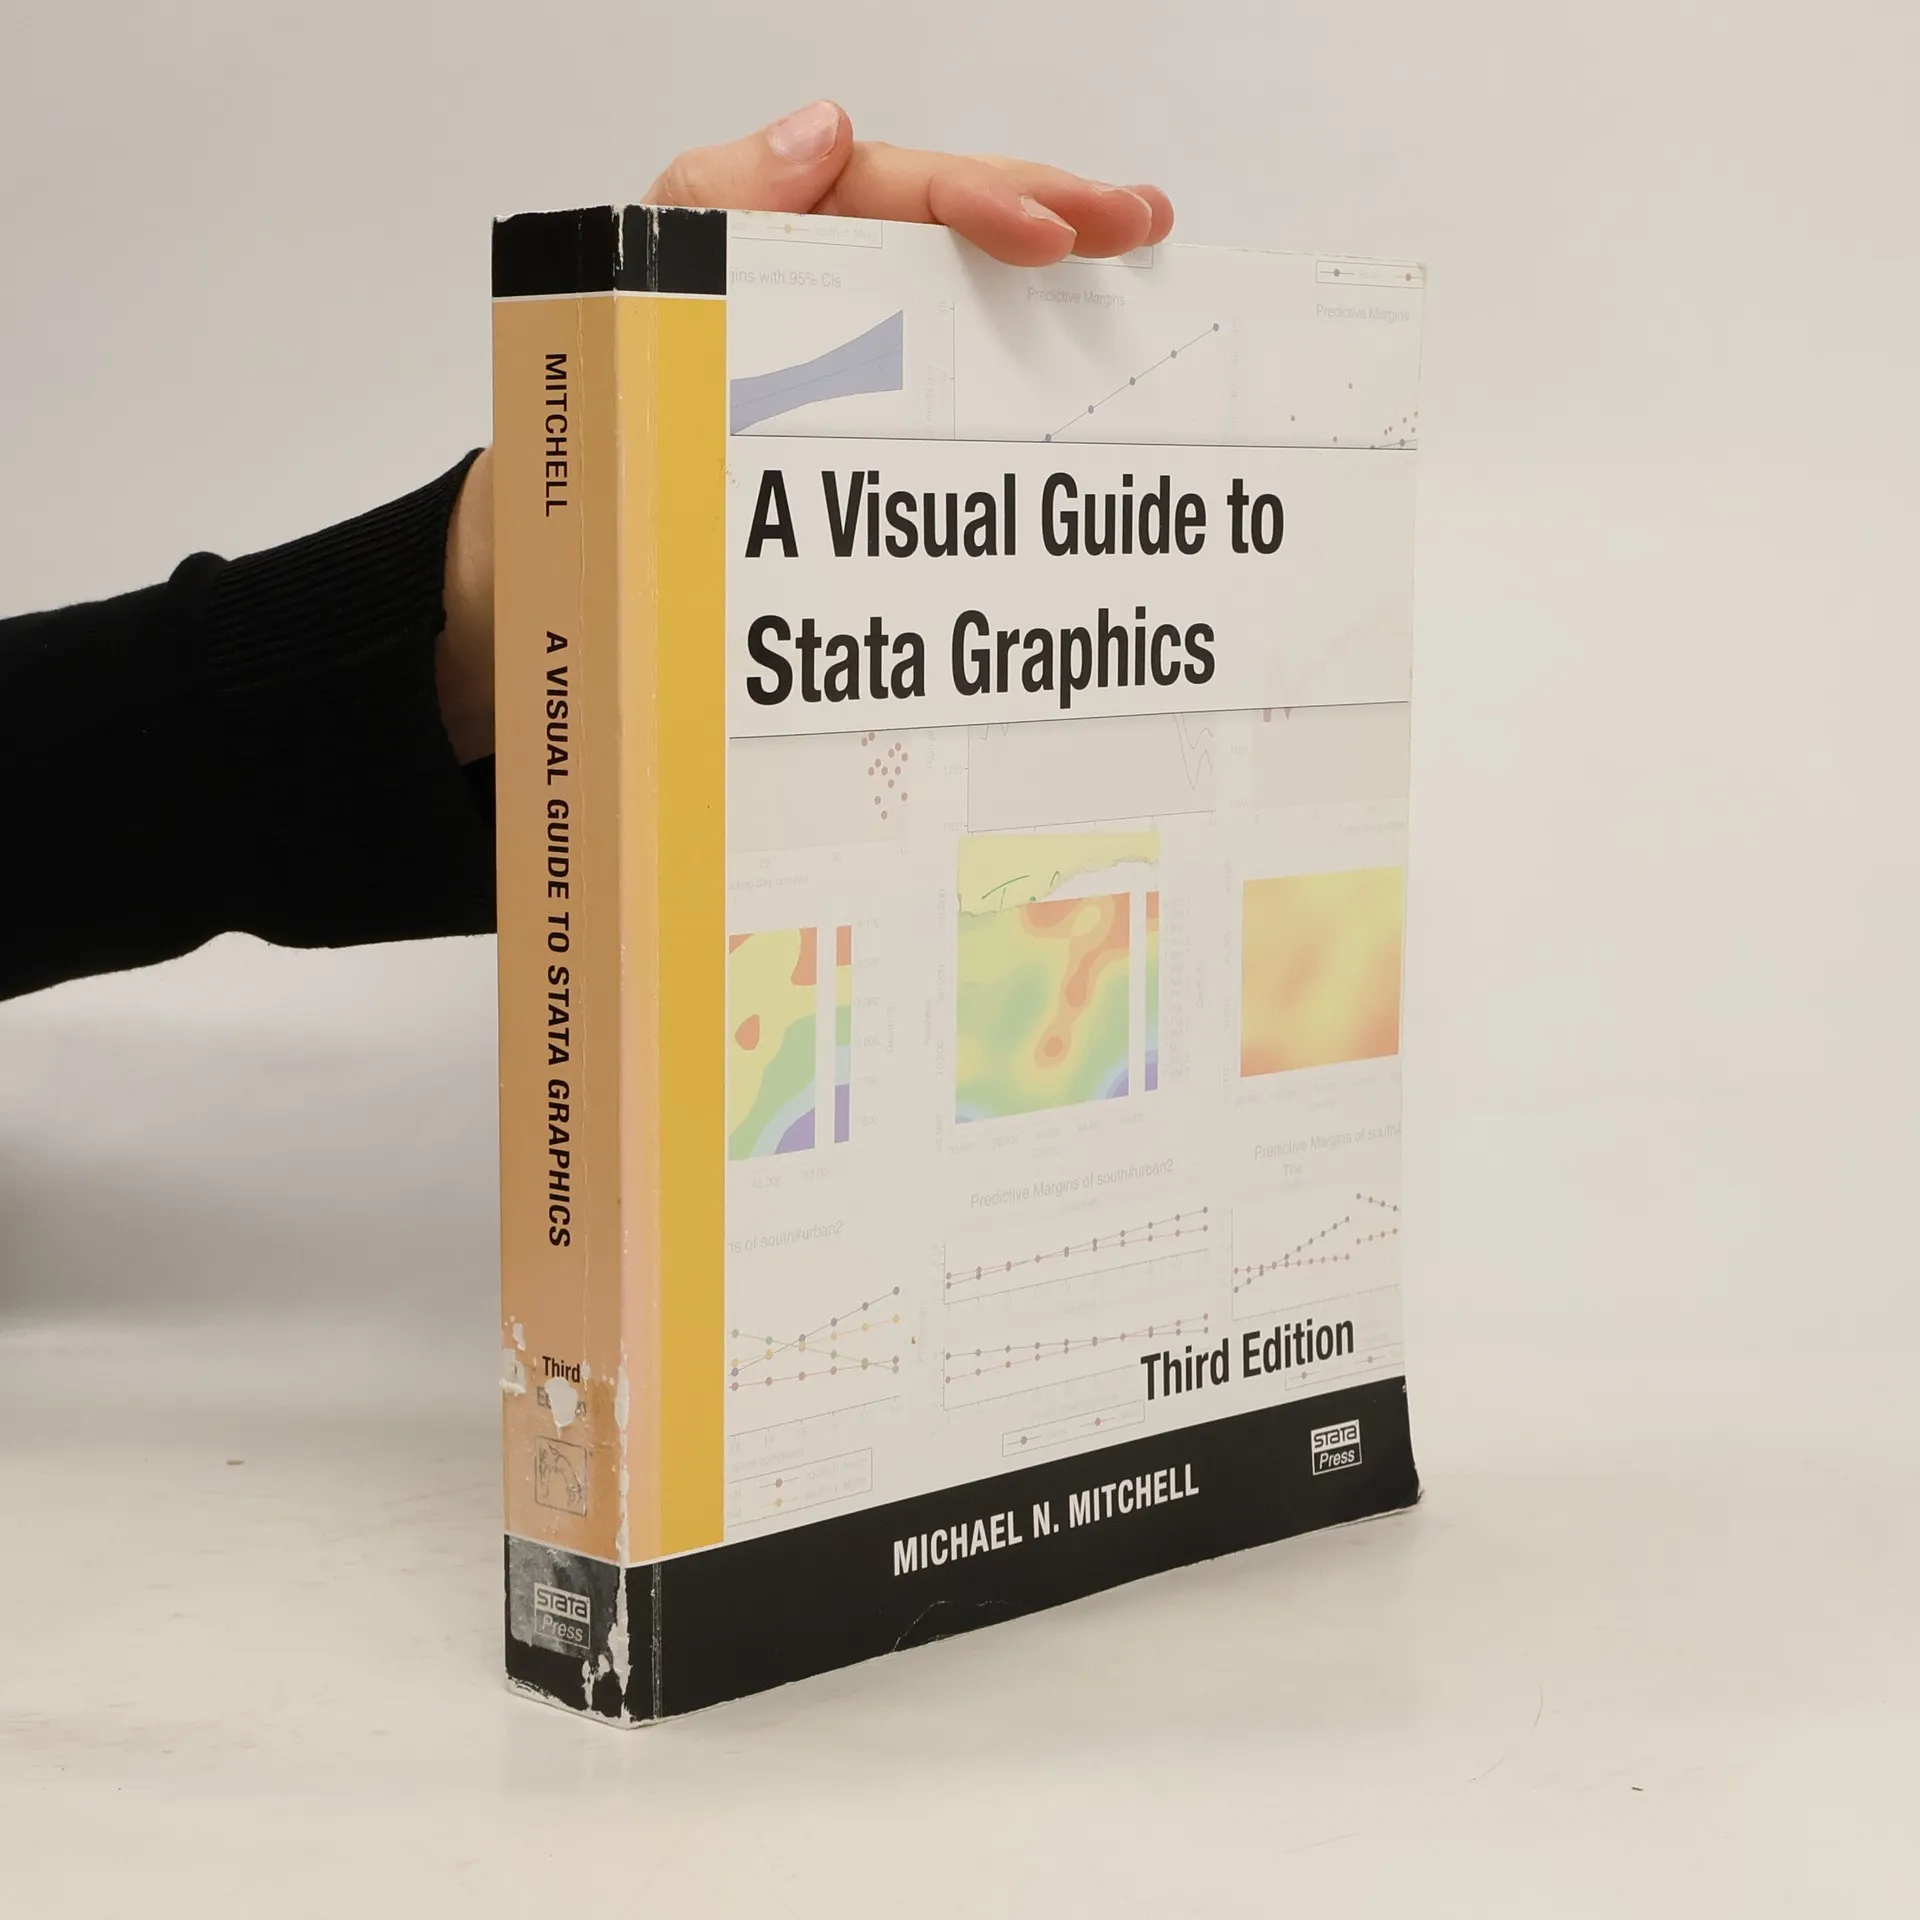
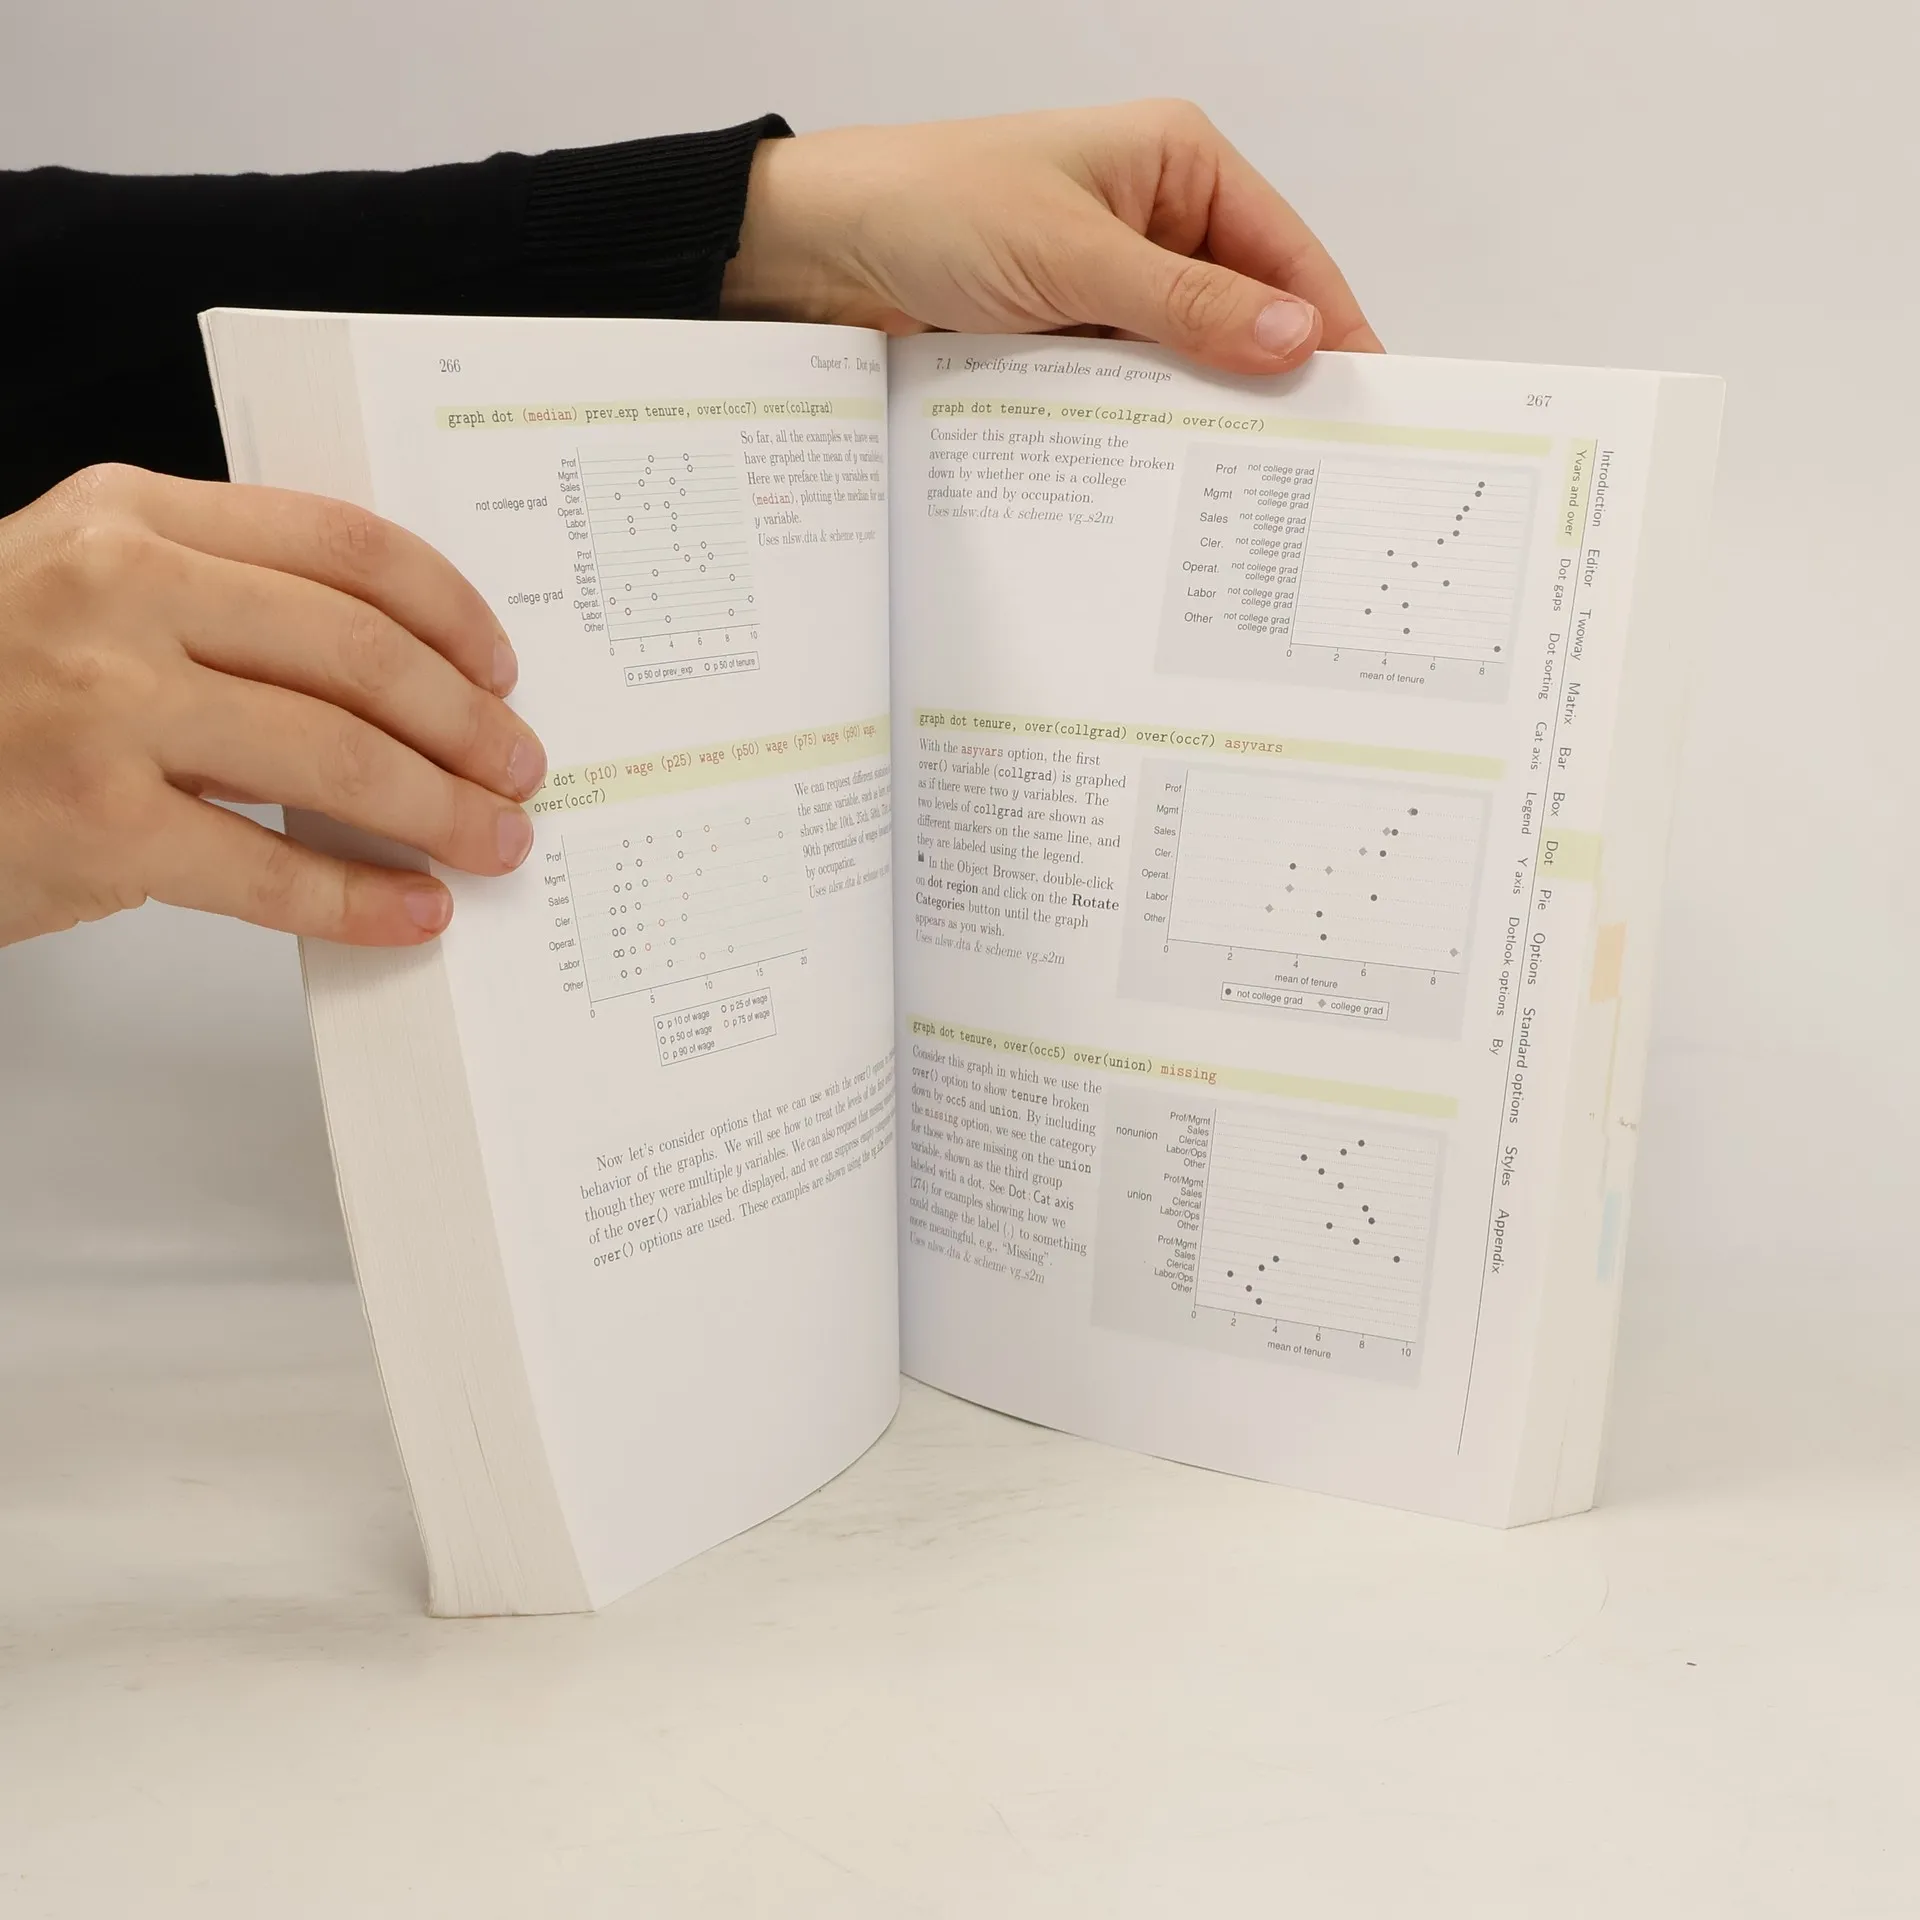
Whether you are new to Stata graphics or a seasoned veteran, A Visual Guide to Stata Graphics, Third Edition will reach you how to use Stata to make publication-quality graphics that will stand out and enhance your statistical results. With over 900 illustrated examples and quick-reference tabs, this book quickly guides you to the information you need for creating and customizing high-quality graphs for any type of statistical data. Each graph is displayed in full color with simple and clear instructions that illustrate how to create and customize graphs using either Stata commands or the Stata Graph Editor. Stata s powerful graphics system gives you complete control over how the elements of your graph look, from marker symbols to lines, from legends to captions and titles, from axis labels to grid lines, and more. Whether you use this book as a learning tool or a quick reference, you will have the power of Stata graphics at your fingertips. The third edition has been updated and expanded to reflect new Stat graphics features, and includes many additional examples. This updated edition illustrates new features to specify fonts and symbols. New sections have been added that illustrate the use of the marginsplot command as well as the use of contour plots. "
Zakup książki
A Visual Guide to Stata Graphics Third Edition, Michael N. Mitchell
- Język

- Rok wydania
- 2012
- Oprawa
- (miękka)
Metody płatności
Brakuje nam tutaj Twojej recenzji.
- Tytuł
- A Visual Guide to Stata Graphics Third Edition
- Język
- angielski
- Autorzy
- Michael N. Mitchell
- Wydawca
- Stata Press
- Rok wydania
- 2012
- Oprawa
- miękka
- Liczba stron
- 499
- ISBN10
- 1597181064
- ISBN13
- 9781597181068
- Seria
- Tagi
- Ocena
- 4,3 z 5
- Opis
- Whether you are new to Stata graphics or a seasoned veteran, A Visual Guide to Stata Graphics, Third Edition will reach you how to use Stata to make publication-quality graphics that will stand out and enhance your statistical results. With over 900 illustrated examples and quick-reference tabs, this book quickly guides you to the information you need for creating and customizing high-quality graphs for any type of statistical data. Each graph is displayed in full color with simple and clear instructions that illustrate how to create and customize graphs using either Stata commands or the Stata Graph Editor. Stata s powerful graphics system gives you complete control over how the elements of your graph look, from marker symbols to lines, from legends to captions and titles, from axis labels to grid lines, and more. Whether you use this book as a learning tool or a quick reference, you will have the power of Stata graphics at your fingertips. The third edition has been updated and expanded to reflect new Stat graphics features, and includes many additional examples. This updated edition illustrates new features to specify fonts and symbols. New sections have been added that illustrate the use of the marginsplot command as well as the use of contour plots. "