

Więcej o książce
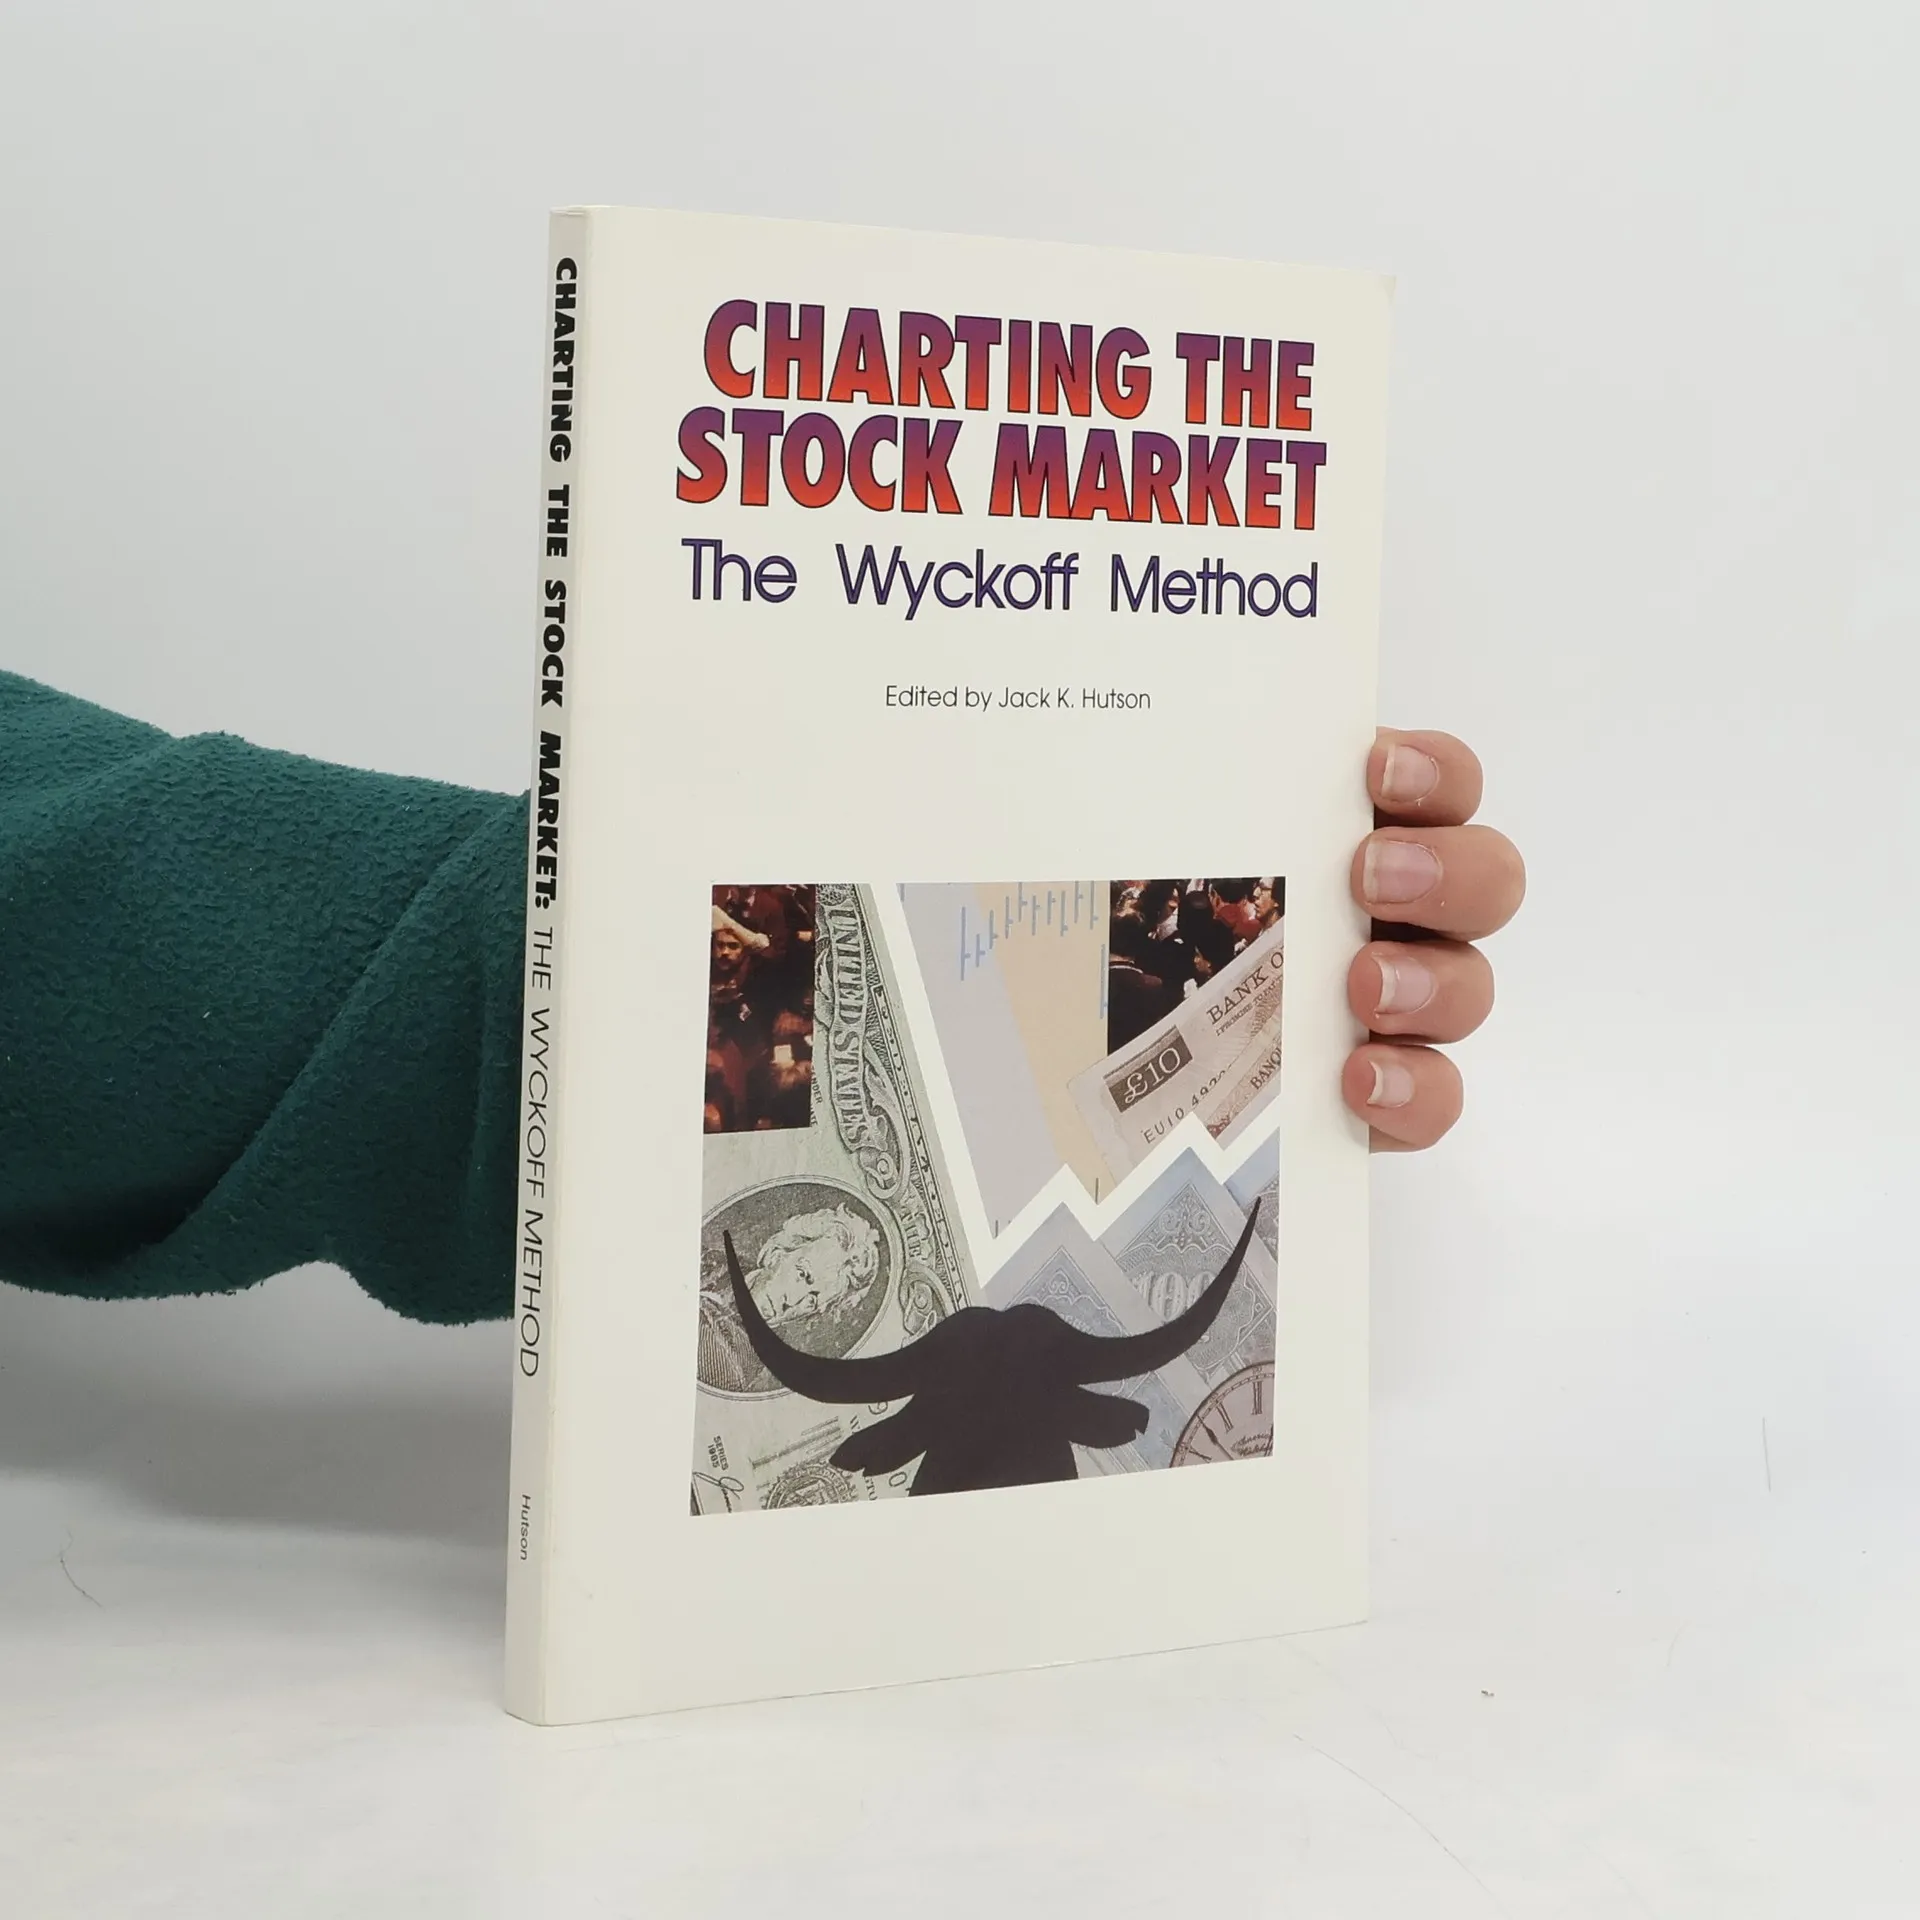
Charting The Stock The Wyckoff Method, takes a modern look at a seminal way to use technical the Wyckoff method. Charting The Stock Market presents and explains how to use the Wyckoff method for investing and trading in stocks, bonds, and commodities. This method was first documented by Richard D. Wyckoff (a trader and market forecaster who started in the business in 1888 as a 15-year-old stock runner) and published in the 1930s. Charting The Stock Market applies these classic and time-honored principles to today's market. Back to the The Wyckoff method principally uses price charting and volume studies as a means of analyzing and forecasting the stock market. It incorporates a common-sense approach to trading that emphasizes study, practice and risk limitation. It also takes into account investor psychology and provides insight into how and why professional traders buy and sell issues. Charting The Stock Market takes the reader step by step through the Wyckoff first, the basic principles; second, examples of the method applied to the bond market; and third, an outline of steps to put the method to use. Details of the Wyckoff method covered in this book * point and figure charting * trends * price and volume studies on vertical charts * stop orders * forecasting * wave charts & intraday * group stock behavior * stock selection criteria, and much more ...
Zakup książki
Charting the Stock Market, Jack K. Hutson, David H Weis, Craig F. Schroeder
- Język

- Rok wydania
- 1991
- Oprawa
- (miękka)
Metody płatności
Brakuje nam tutaj Twojej recenzji.
- Tytuł
- Charting the Stock Market
- Podtytuł
- The Wyckoff Method
- Język
- angielski
- Autorzy
- Jack K. Hutson, David H Weis, Craig F. Schroeder
- Wydawca
- Technical Analysis
- Rok wydania
- 1991
- Oprawa
- miękka
- Liczba stron
- 204
- ISBN10
- 0938773062
- ISBN13
- 9780938773061
- Seria
- Tagi
- Biznes
- Ocena
- 4,1 z 5
- Opis
- Charting The Stock The Wyckoff Method, takes a modern look at a seminal way to use technical the Wyckoff method. Charting The Stock Market presents and explains how to use the Wyckoff method for investing and trading in stocks, bonds, and commodities. This method was first documented by Richard D. Wyckoff (a trader and market forecaster who started in the business in 1888 as a 15-year-old stock runner) and published in the 1930s. Charting The Stock Market applies these classic and time-honored principles to today's market. Back to the The Wyckoff method principally uses price charting and volume studies as a means of analyzing and forecasting the stock market. It incorporates a common-sense approach to trading that emphasizes study, practice and risk limitation. It also takes into account investor psychology and provides insight into how and why professional traders buy and sell issues. Charting The Stock Market takes the reader step by step through the Wyckoff first, the basic principles; second, examples of the method applied to the bond market; and third, an outline of steps to put the method to use. Details of the Wyckoff method covered in this book * point and figure charting * trends * price and volume studies on vertical charts * stop orders * forecasting * wave charts & intraday * group stock behavior * stock selection criteria, and much more ...