

Więcej o książce
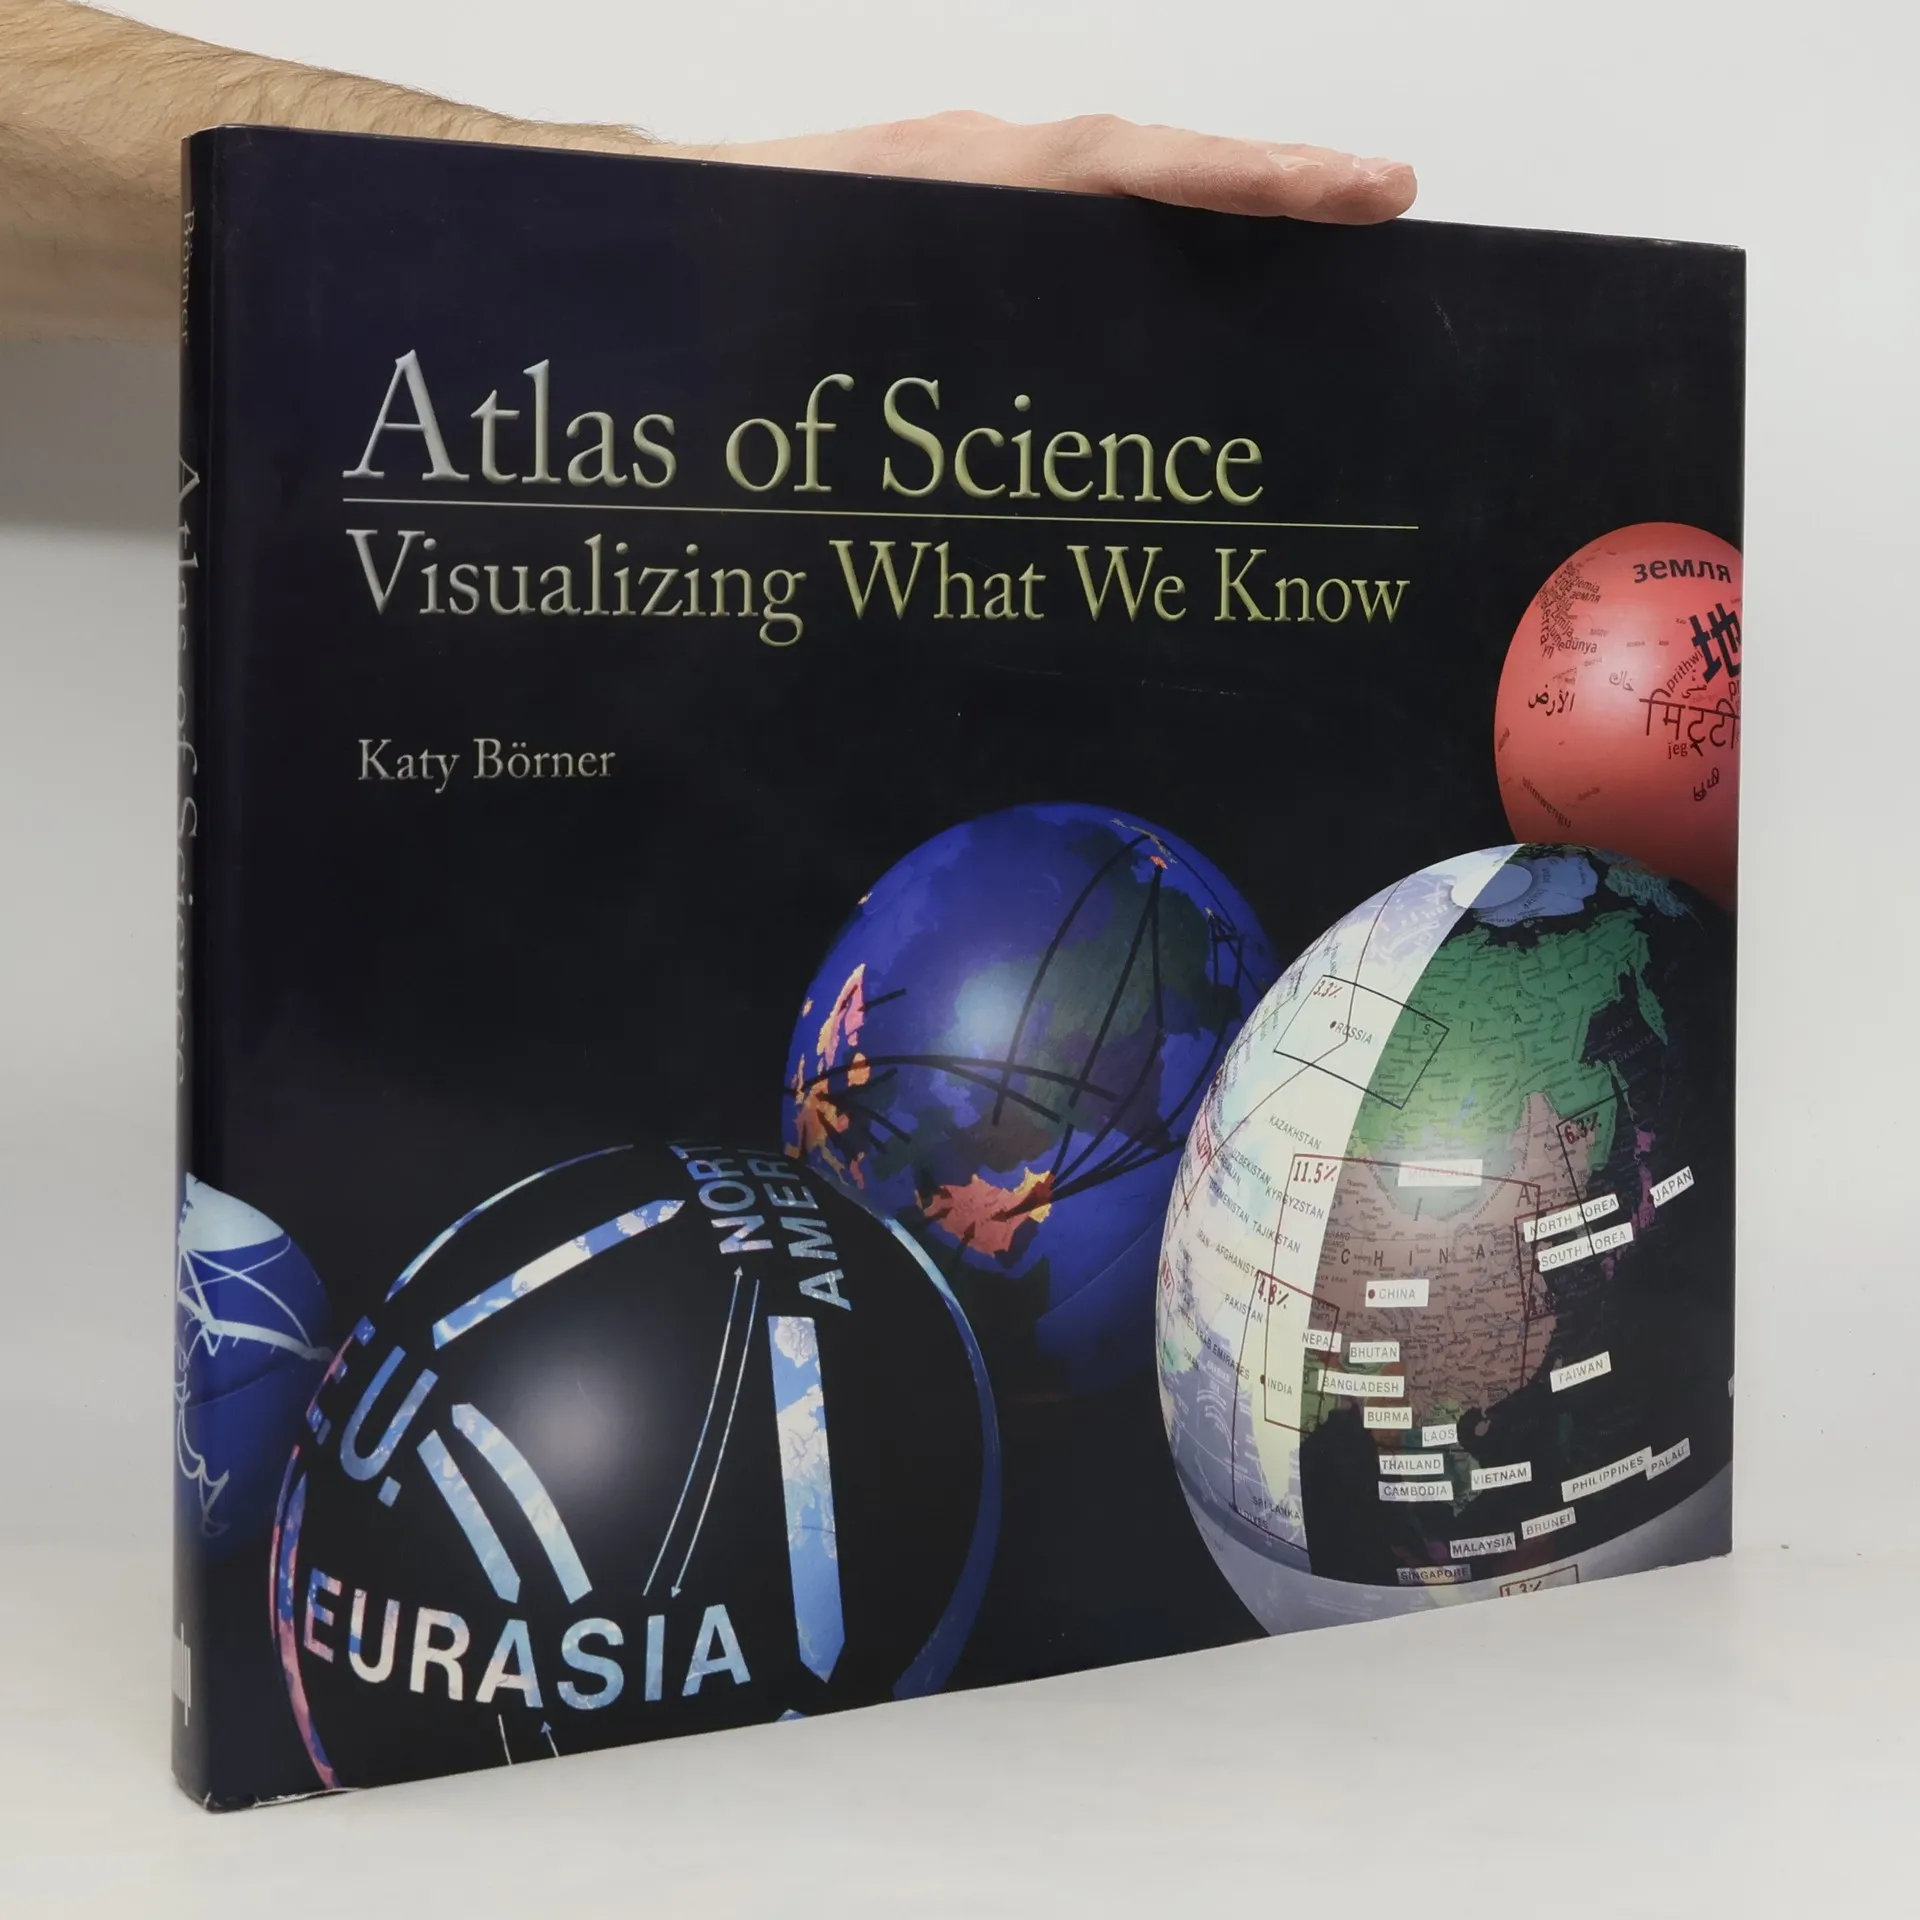
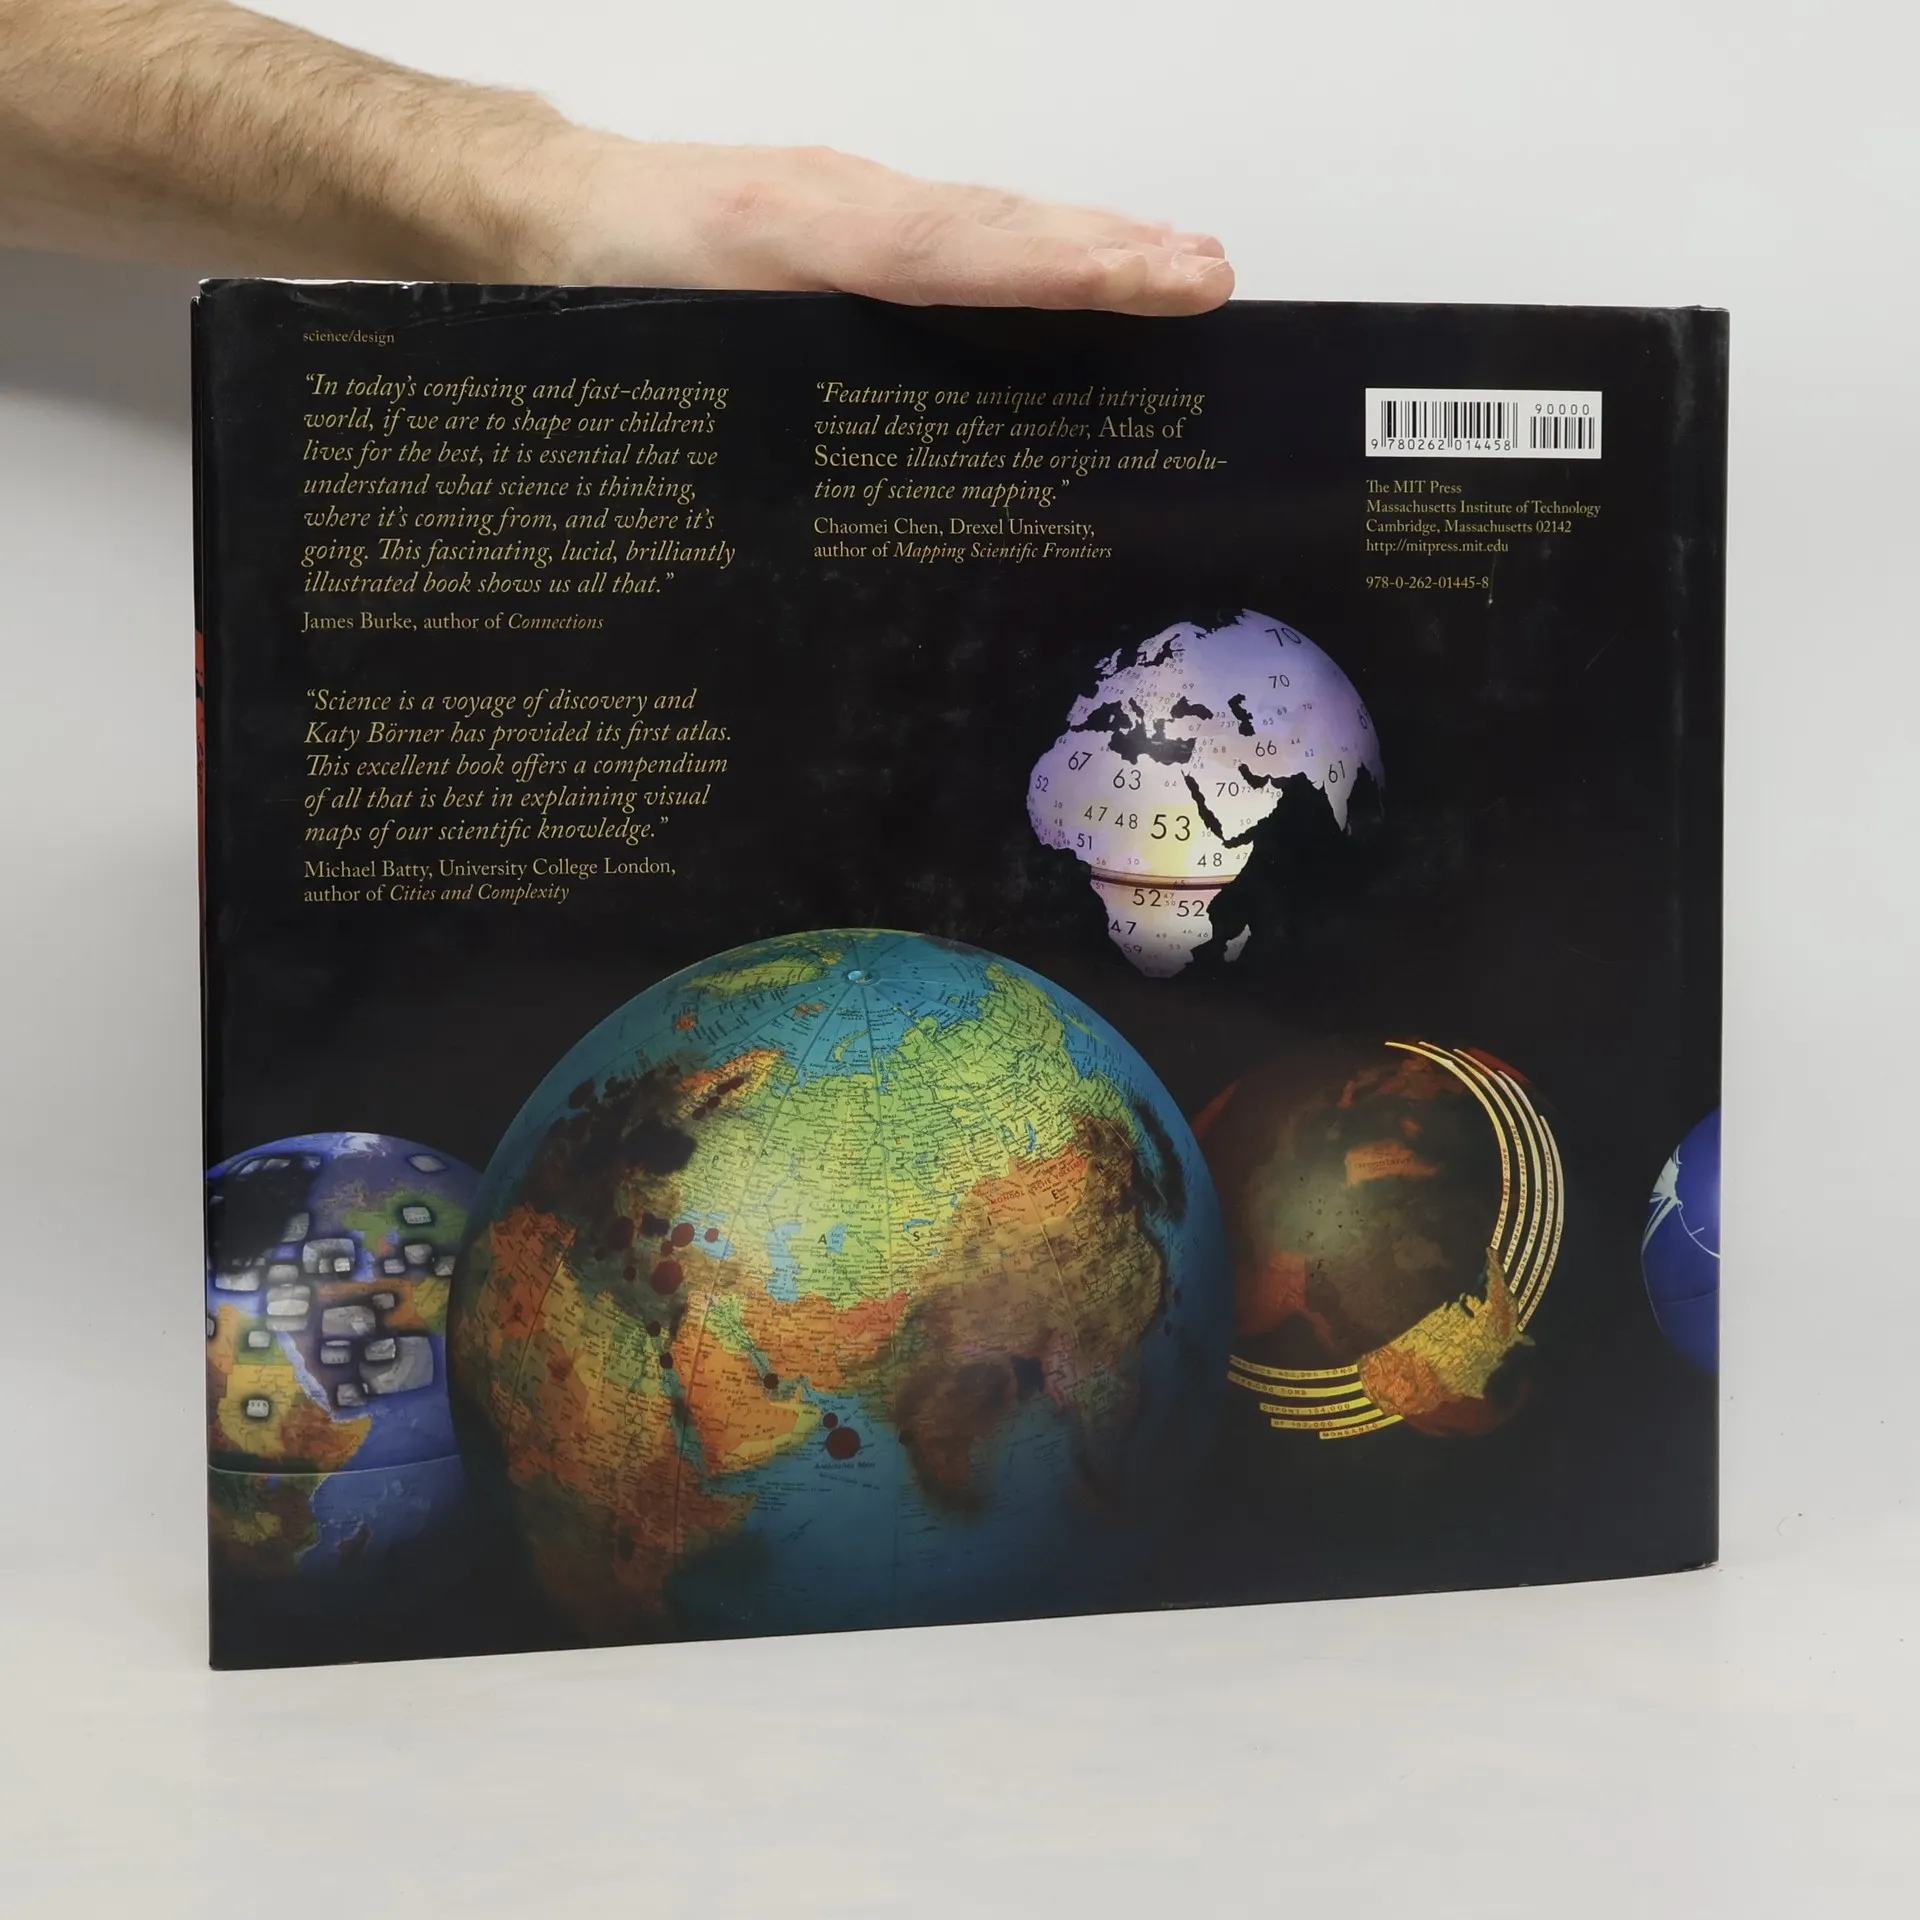
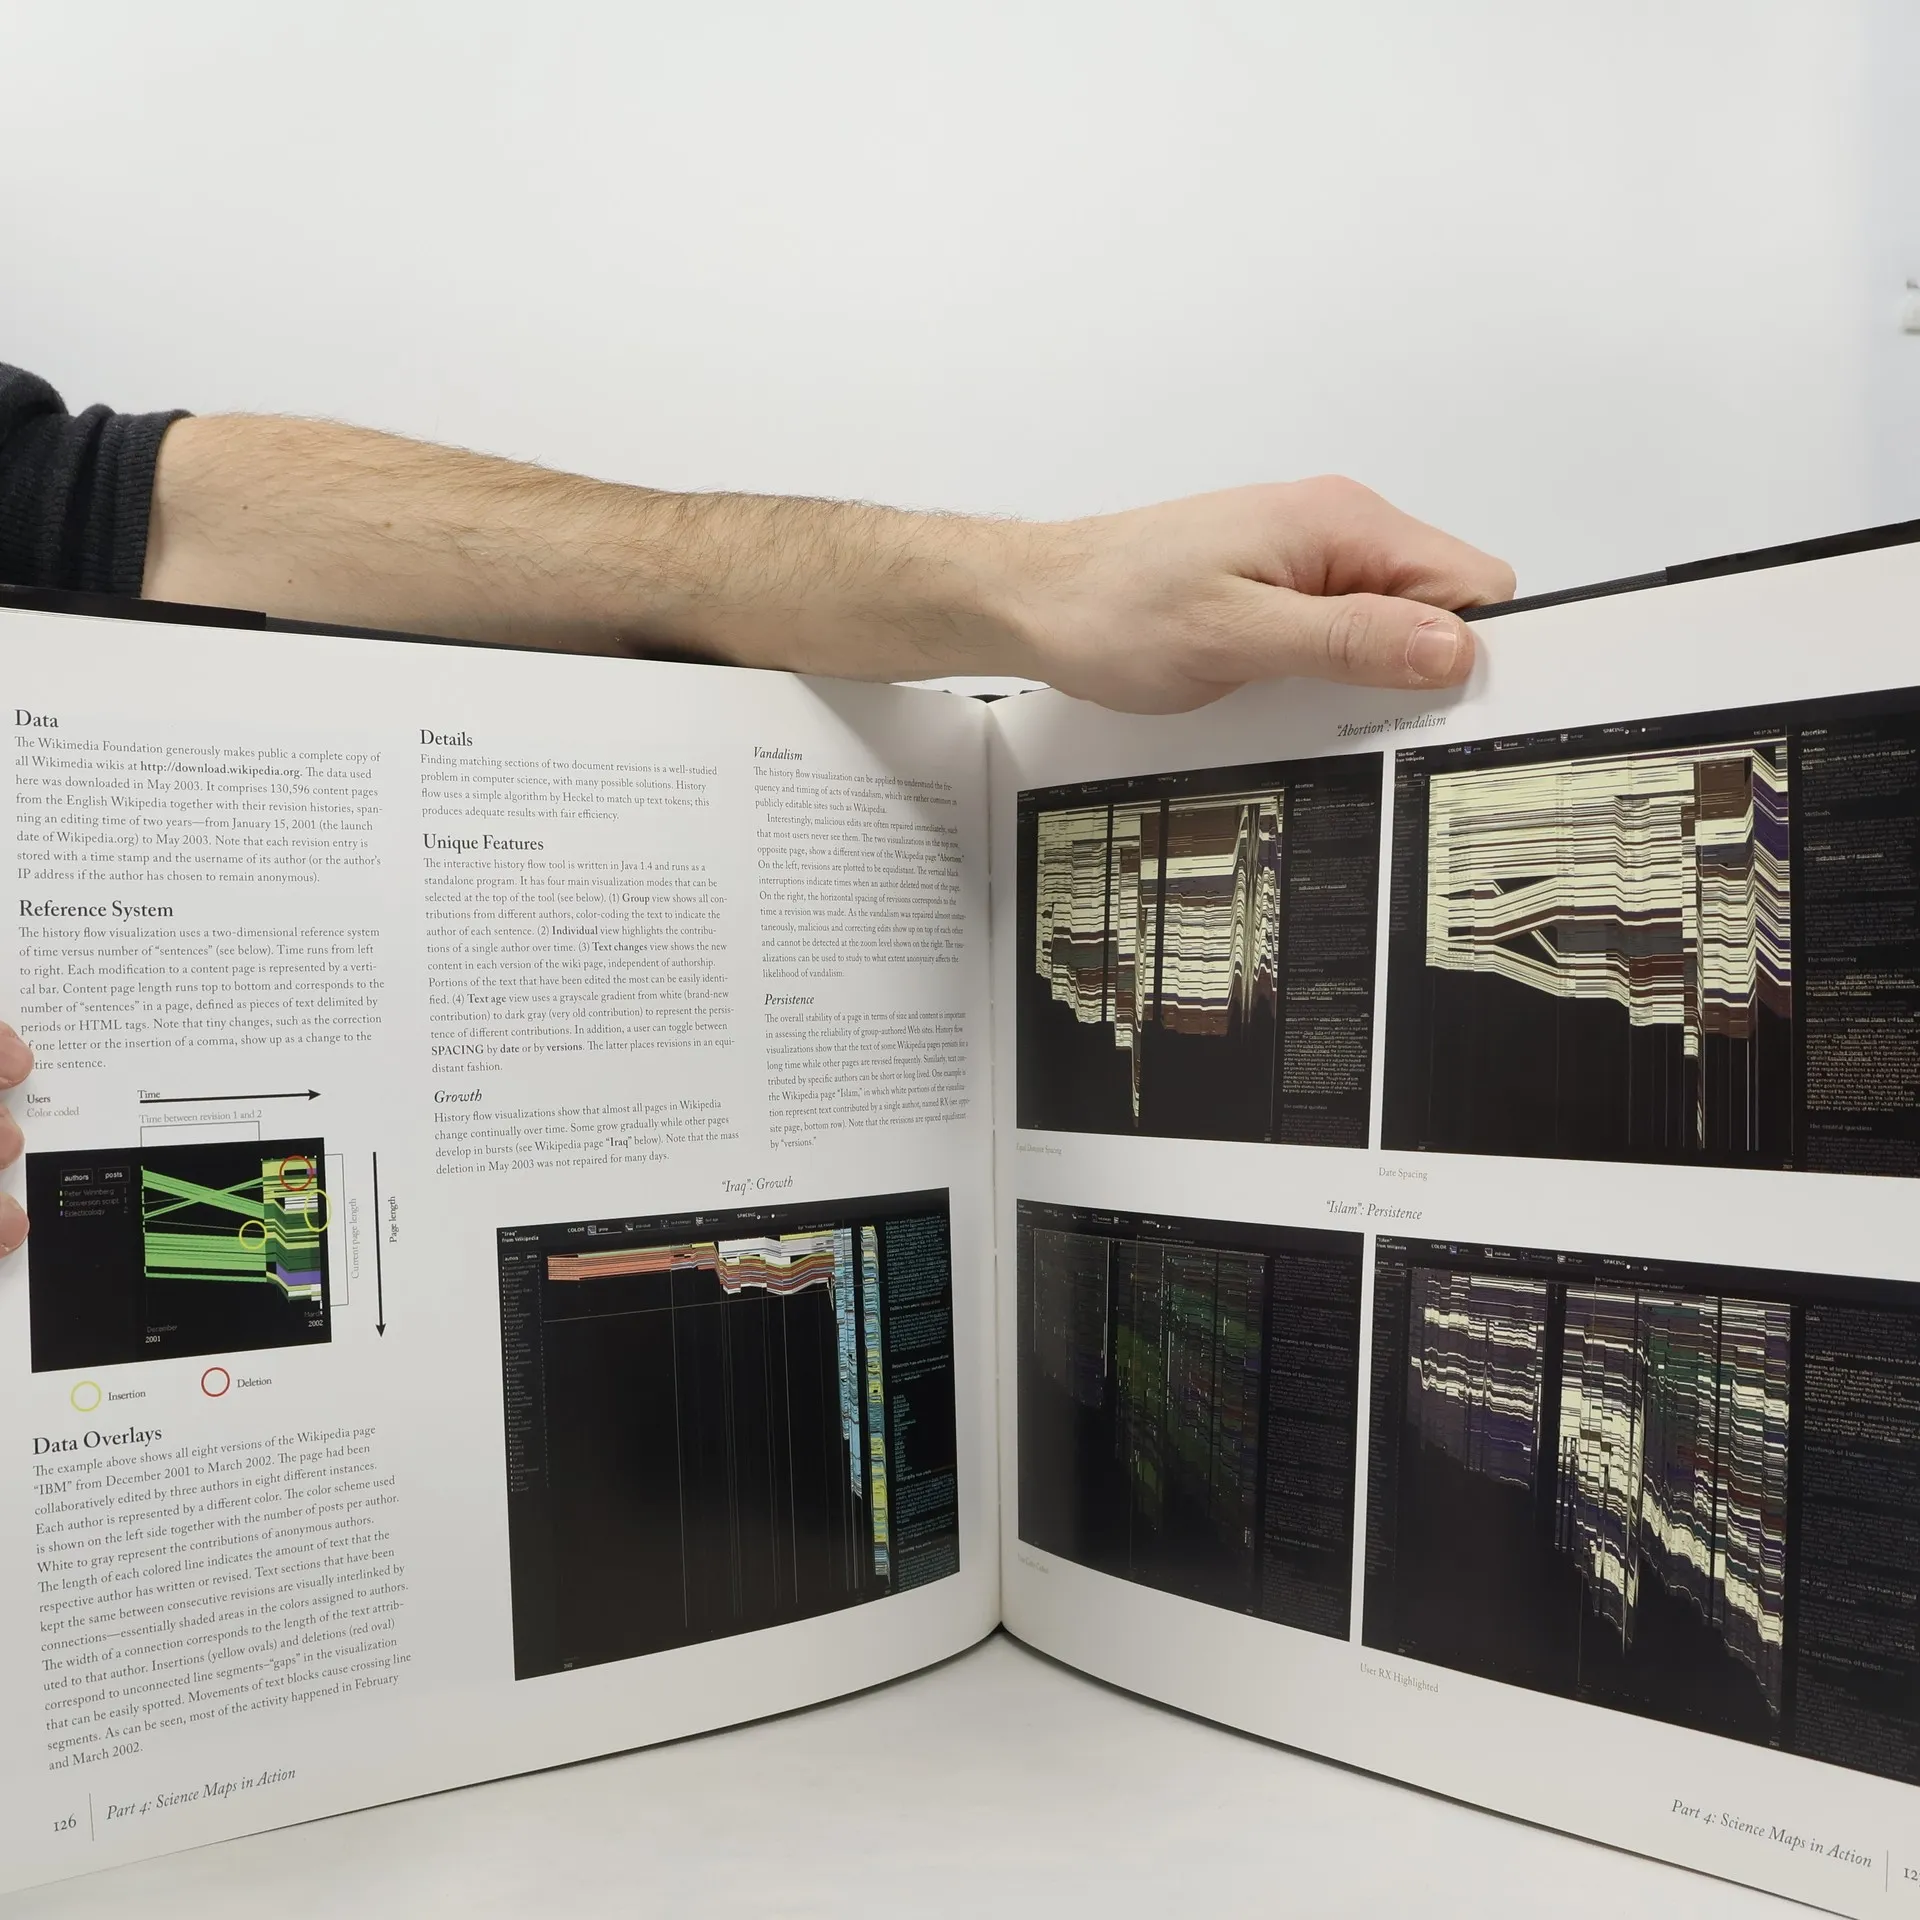
Cartographic maps have long guided our explorations, and science maps can similarly help us navigate the complex landscape of knowledge in science and technology. They enable us to visualize scientific results, making sense of the vast data generated by research today. This work features over thirty full-page science maps, fifty data charts, a timeline of science-mapping milestones, and 500 color images, serving as a visual index to the evolution of modern science and an introduction to "the science of science." Based on the exhibit "Places & Spaces: Mapping Science," it showcases effective mapping techniques. Highlights include Claudius Ptolemy's 1482 Cosmographia World Map, a subway map-style guide to a PhD thesis, a citation relationship map from 2002, a periodic table, a flow visualization of the Wikipedia article on abortion, a globe of global patent distribution, earthquake risk forecasts, and interactive science maps for kids. Each entry tells the story behind the map and includes biographies of its creators. In an age of overwhelming scientific output, science maps illuminate the landscape of our knowledge. Ongoing exhibitions are hosted by the National Science Foundation in Washington, D.C., the Institute for Research Information and Quality Assurance in Bonn, Germany, and Storm Hall at San Diego State College.
Zakup książki
Atlas of Science, Katy Börner
- Język

- Rok wydania
- 2010
- Oprawa
- (twarda)
Metody płatności
Brakuje nam tutaj Twojej recenzji.
- Tytuł
- Atlas of Science
- Podtytuł
- Visualizing What We Know
- Język
- angielski
- Autorzy
- Katy Börner
- Wydawca
- MIT Press
- Rok wydania
- 2010
- Oprawa
- twarda
- Liczba stron
- 272
- ISBN10
- 0262014459
- ISBN13
- 9780262014458
- Seria
- Kategorie
- Tagi
- Przyroda, Inna historie
- Ocena
- 4,3 z 5
- Opis
- Cartographic maps have long guided our explorations, and science maps can similarly help us navigate the complex landscape of knowledge in science and technology. They enable us to visualize scientific results, making sense of the vast data generated by research today. This work features over thirty full-page science maps, fifty data charts, a timeline of science-mapping milestones, and 500 color images, serving as a visual index to the evolution of modern science and an introduction to "the science of science." Based on the exhibit "Places & Spaces: Mapping Science," it showcases effective mapping techniques. Highlights include Claudius Ptolemy's 1482 Cosmographia World Map, a subway map-style guide to a PhD thesis, a citation relationship map from 2002, a periodic table, a flow visualization of the Wikipedia article on abortion, a globe of global patent distribution, earthquake risk forecasts, and interactive science maps for kids. Each entry tells the story behind the map and includes biographies of its creators. In an age of overwhelming scientific output, science maps illuminate the landscape of our knowledge. Ongoing exhibitions are hosted by the National Science Foundation in Washington, D.C., the Institute for Research Information and Quality Assurance in Bonn, Germany, and Storm Hall at San Diego State College.