



Więcej o książce
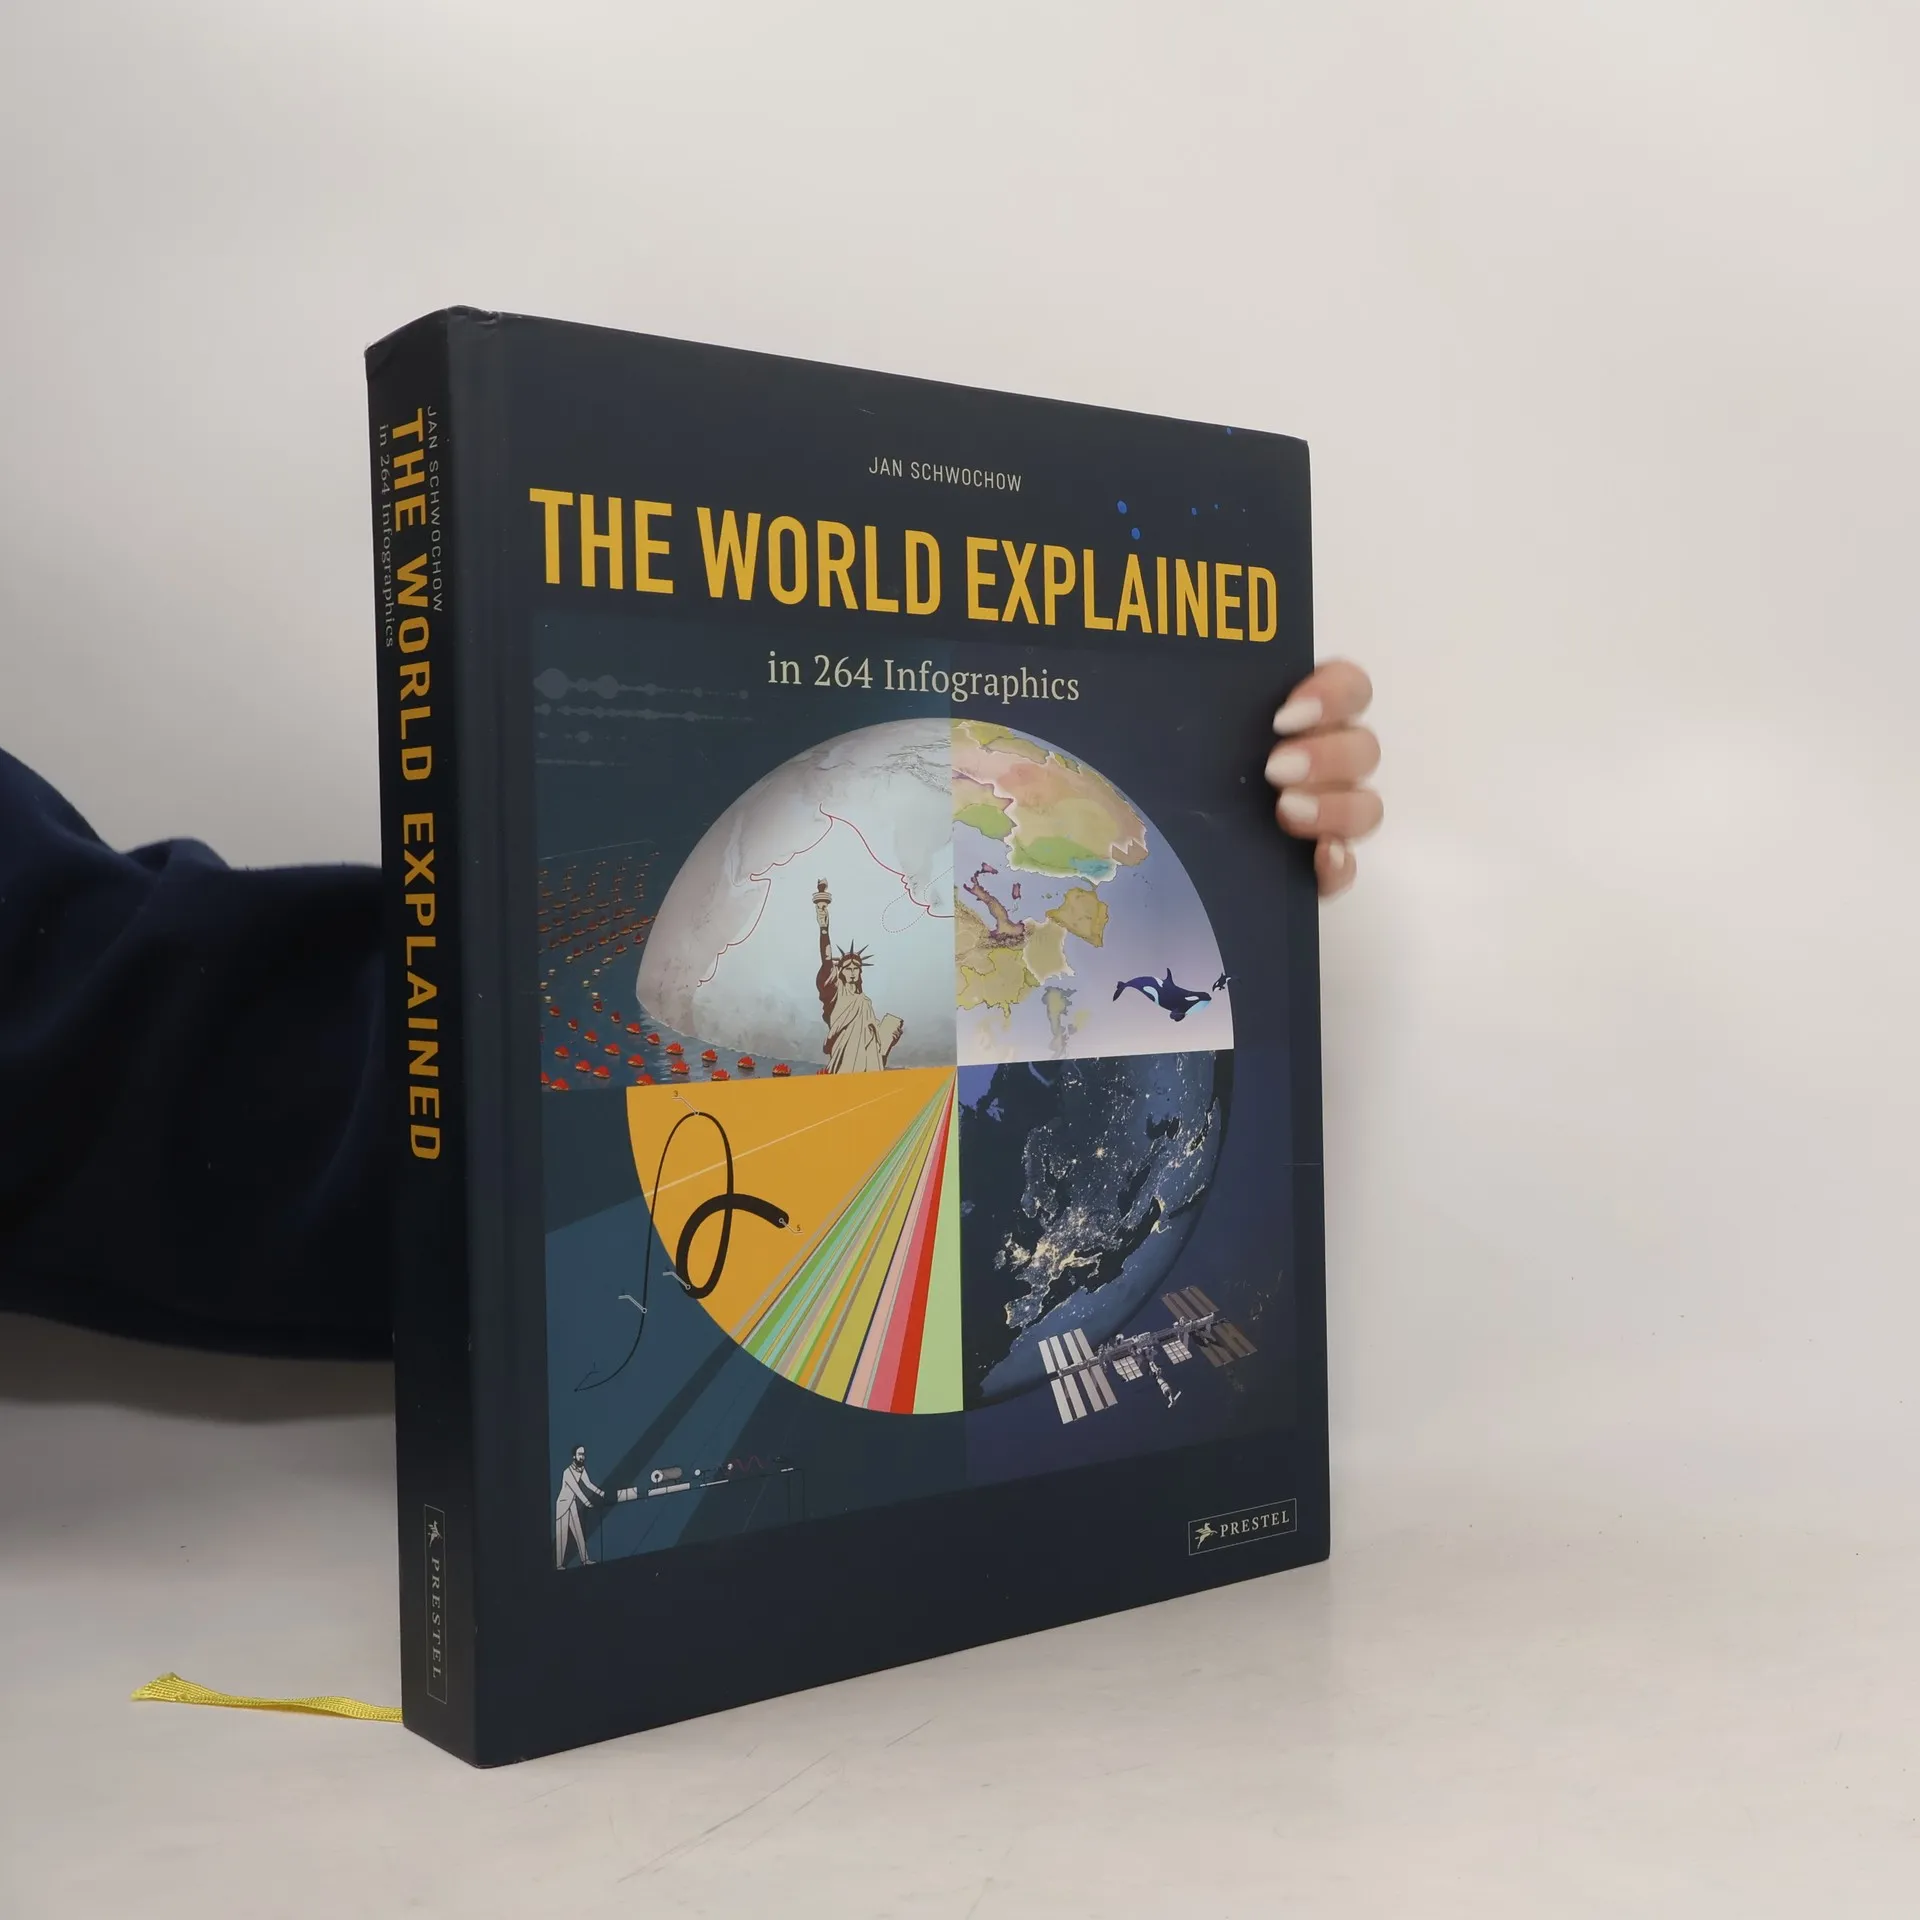
Take a deep dive into history, economics, art, and culture through fascinating and stunning visuals. We live in a hyper-connected world and are bombarded with news and other information, via our phones, computers, TVs, and radios. People don't have the time or energy to sift through all the data. That's where infographics come in. While the idea of illustrating facts and figures has been around for centuries, it is only recently, with the introduction of the internet, that infographics have really taken off as a medium to convey all types of information. This book shows the versatility of infographics by presenting an amazing compendium of 264 charts. Illustrating topics such as history, economics, sports, music, art, science, and culture, the infographics in this book are all designed to be easy to understand, thought-provoking, and elegant. You can explore the evolution of electric vehicles from a tricycle to a Tesla Model 3, discover how supermarkets trick you into buying more food than you need, and see how much work goes into creating a video game. While you browse the pages, you'll find yourself incidentally learning thousands of new things that will astonish you. By condensing and conveying facts as an illustrated narrative, infographics tell stories that everyone can explore, understand, and enjoy.

Zakup książki
The World Explained in 264 Infographics, Jan Schwochow
- Język

- Rok wydania
- 2021
- Oprawa
- (twarda)
Metody płatności
Brakuje nam tutaj Twojej recenzji.
- Tytuł
- The World Explained in 264 Infographics
- Język
- angielski
- Autorzy
- Jan Schwochow
- Wydawca
- Prestel Publishing
- Rok wydania
- 2021
- Oprawa
- twarda
- Liczba stron
- 568
- ISBN10
- 3791387154
- ISBN13
- 9783791387154
- Seria
- Kategorie
- Tagi
- Nauka
- Ocena
- 3,85 z 5
- Opis
- Take a deep dive into history, economics, art, and culture through fascinating and stunning visuals. We live in a hyper-connected world and are bombarded with news and other information, via our phones, computers, TVs, and radios. People don't have the time or energy to sift through all the data. That's where infographics come in. While the idea of illustrating facts and figures has been around for centuries, it is only recently, with the introduction of the internet, that infographics have really taken off as a medium to convey all types of information. This book shows the versatility of infographics by presenting an amazing compendium of 264 charts. Illustrating topics such as history, economics, sports, music, art, science, and culture, the infographics in this book are all designed to be easy to understand, thought-provoking, and elegant. You can explore the evolution of electric vehicles from a tricycle to a Tesla Model 3, discover how supermarkets trick you into buying more food than you need, and see how much work goes into creating a video game. While you browse the pages, you'll find yourself incidentally learning thousands of new things that will astonish you. By condensing and conveying facts as an illustrated narrative, infographics tell stories that everyone can explore, understand, and enjoy.